Architecture
Symbolication turns a minified or stripped production stack trace back into the source locations your team wrote. The runtime only ever reports positions into compiled output: a column in a shipped bundle, a program counter in stripped machine code. The debug info your build emitted is what maps those positions back to a file, line, and function. The symbolicator is the engine that does that mapping, and this page is how it fits together, independent of which language produced the trace.
The same engine runs three ways:
- At ingest, inside Traceway, so issues are stored already symbolicated.
- As an OpenTelemetry Collector processor, so traces are rewritten before they reach any backend.
- As an importable Go library, so you can call it from your own tooling.
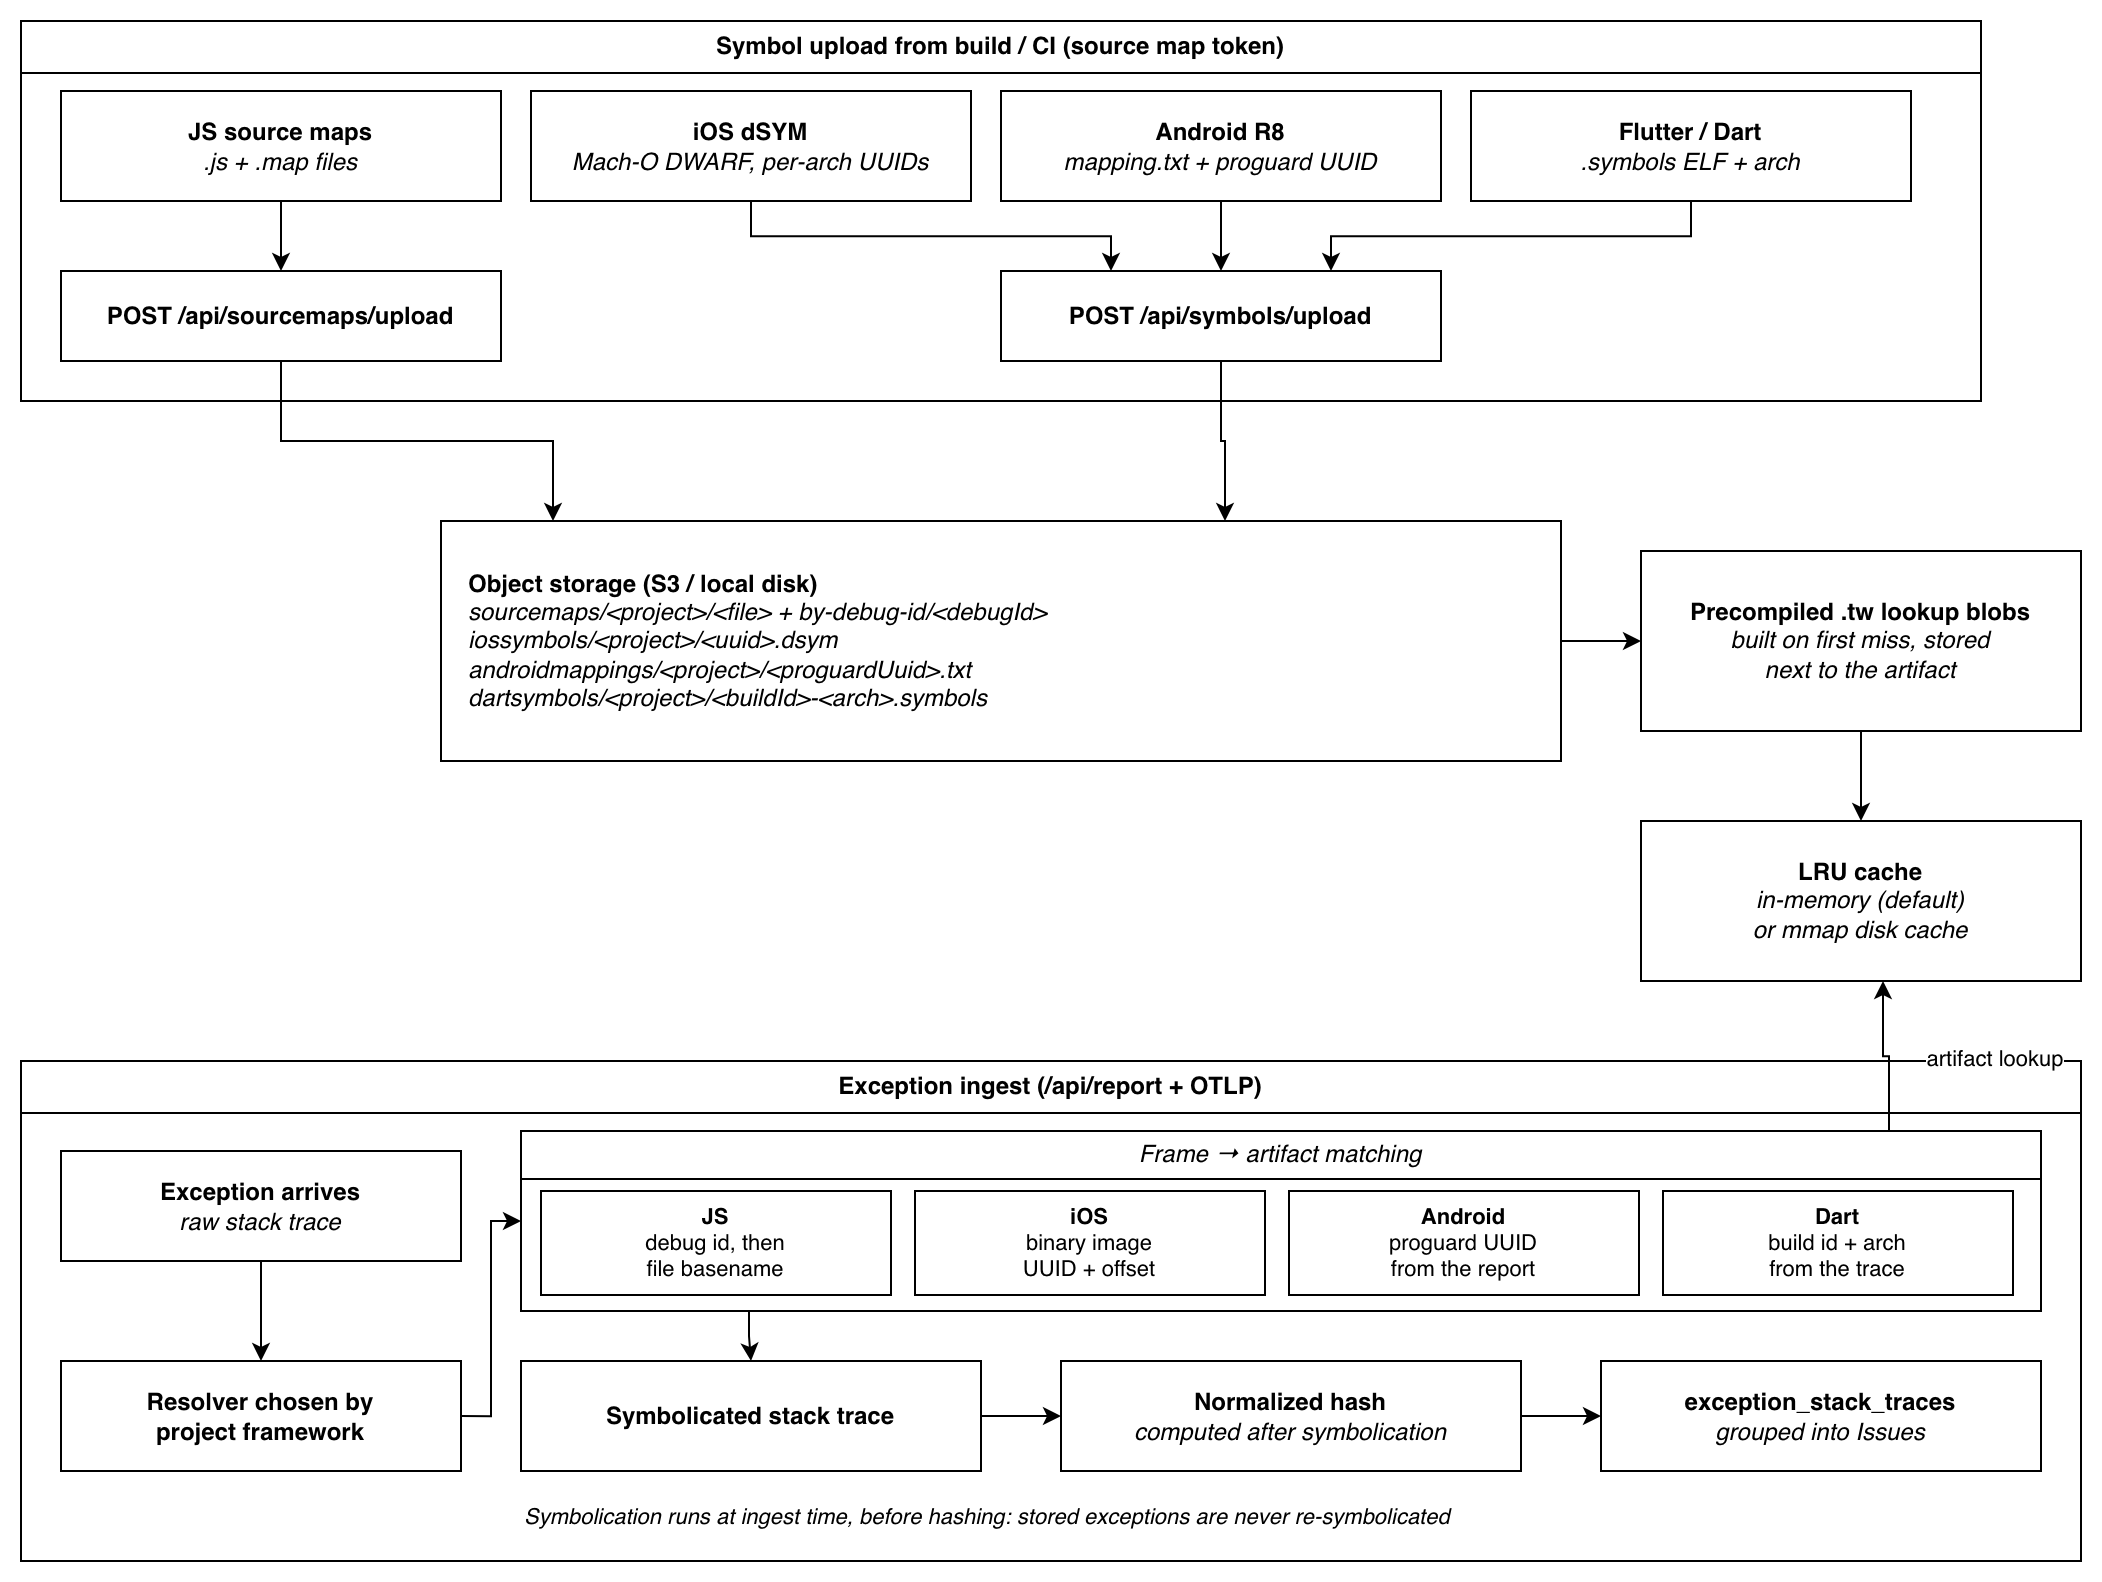
When and where symbolication runs
Symbolication happens once, at ingest. A report arrives, each stack trace is resolved frame by frame, and the resolved trace is what gets hashed for grouping and stored. Nothing is re-resolved when you view an issue later.
The trade-off is that stored traces are immutable snapshots of the symbolication quality at the moment they arrived. Uploading better debug info improves future events, not past ones.
This is dispatched by the trace, not configured per project: a browser exception resolves against source maps, a Flutter exception against its symbols, an iOS crash against its dSYM, and the engine picks the path from the SDK language and the shape of the trace. The collector processor and the library do the same work at a different point in the pipeline.
The pipeline
Whatever the language, resolution is four steps:
- Fetch the raw debug info for the build from a store.
- Compile it into a resolver and serialize that to a
.twfile. This is the expensive step, and it happens once per build artifact. - Cache the
.twso later lookups skip the compile. - Look up each frame against the resolver and rewrite it.
Building is slow and happens once per artifact. Looking up is a binary search and happens once per frame. The .tw format is what lets those two costs live in different places, and even different processes.
The .tw resolver format
Every language ships debug info in its own shape, but it all answers one question: given a position in the compiled output, what source location and function produced it? The engine compiles each shape into the same kind of artifact, a .tw file, built for fast range lookups and designed to be memory-mapped and used in place.
The structure is the same regardless of where the debug info came from:
- A header with a magic number, a format version, and the table sizes.
- A range table over the address space the runtime reports (a position in a generated file, a program counter in a code section), sorted by start. Each range points at the resolved frames it covers: file, line, column, and function. One range can carry several frames, because a single compiled address can stand for a chain of inlined calls.
- Interned string tables for file and function names, so a name referenced across thousands of ranges is stored once.
Because the ranges are sorted, a lookup is a single binary search. Because the layout is fixed and little-endian, opening a .tw validates its structure and then reads straight from the mapped pages, with no copying or decoding, and the OS page cache shares those pages across every process that maps the same file. Compiling the resolver (parsing the debug info, computing every range, interning every name) runs once at build time; opening the compiled result skips all of it.
A .tw is a cache artifact, never the source of truth. It's versioned by a single integer with no migration path: bump the version and every existing file fails validation and is lazily rebuilt from its original debug info. Each language has its own .tw encoding tuned to its debug format; the per-language specifics are on the JavaScript, Dart, iOS, and Android pages.
Cache tiers
A resolver is expensive to build and cheap to keep, so the engine caches the compiled .tw, not the raw debug info. A lookup walks the tiers from fastest to slowest:
- In-memory LRU. Always present. A hit is a pure memory lookup.
- Local
.twfile (disk tier only). Memory-mapped and opened with validation; on little-endian hosts the tables are used straight from the mapped pages with zero copying. .twfrom object storage. A compiled artifact built earlier, by another instance or before a restart. In disk mode it's written to the local directory and then mapped; in memory mode it's opened on the heap.- Full rebuild from the raw debug info. The finished resolver is serialized to
.twand written back to object storage, so an artifact is compiled once cluster-wide and every other instance downloads the compiled form instead of re-parsing.
Concurrent requests for the same key are deduplicated: the first builds, the rest park and receive the same resolver. The disk directory is itself an LRU bounded by bytes, survives restarts (it's scanned at startup), and deletes any .tw that fails validation so the rebuild path replaces it.
Whether the disk tier earns its keep depends on your corpus size and churn. That's a tuning decision, covered with numbers on Performance.
The store
The store holds the raw debug info, addressed by a deterministic key, behind a single interface: fetch bytes for a key. It has several backends:
- Object storage (S3 or local disk) in Traceway's own ingest path.
file_store,s3_store, orgcs_storein the collector processor.
Raw artifacts are fetched on demand and never kept on local disk by the engine. When a backend is S3 or GCS, the artifact is pulled into memory, compiled into a .tw, and the raw bytes are dropped. The only thing that lands on local disk is the compiled .tw, and only when the disk cache tier is enabled.
Where to go next
- JavaScript: source maps and bundle scope analysis.
- Dart: stripped Flutter traces and DWARF.
- iOS: stripped Swift/ObjC release crashes and dSYM/DWARF.
- Android: obfuscated R8 release crashes and
mapping.txtretrace. - Performance: memory vs disk cache, sizing, benchmarks, and the metrics to watch.
- OpenTelemetry: running the engine as a collector processor.
- Library: calling the engine from your own Go code.