Architecture Overview
Traceway's mental model is small. There's one underlying primitive, spans, and a handful of materialized views over those spans that make the dashboard fast.
The primitive: spans
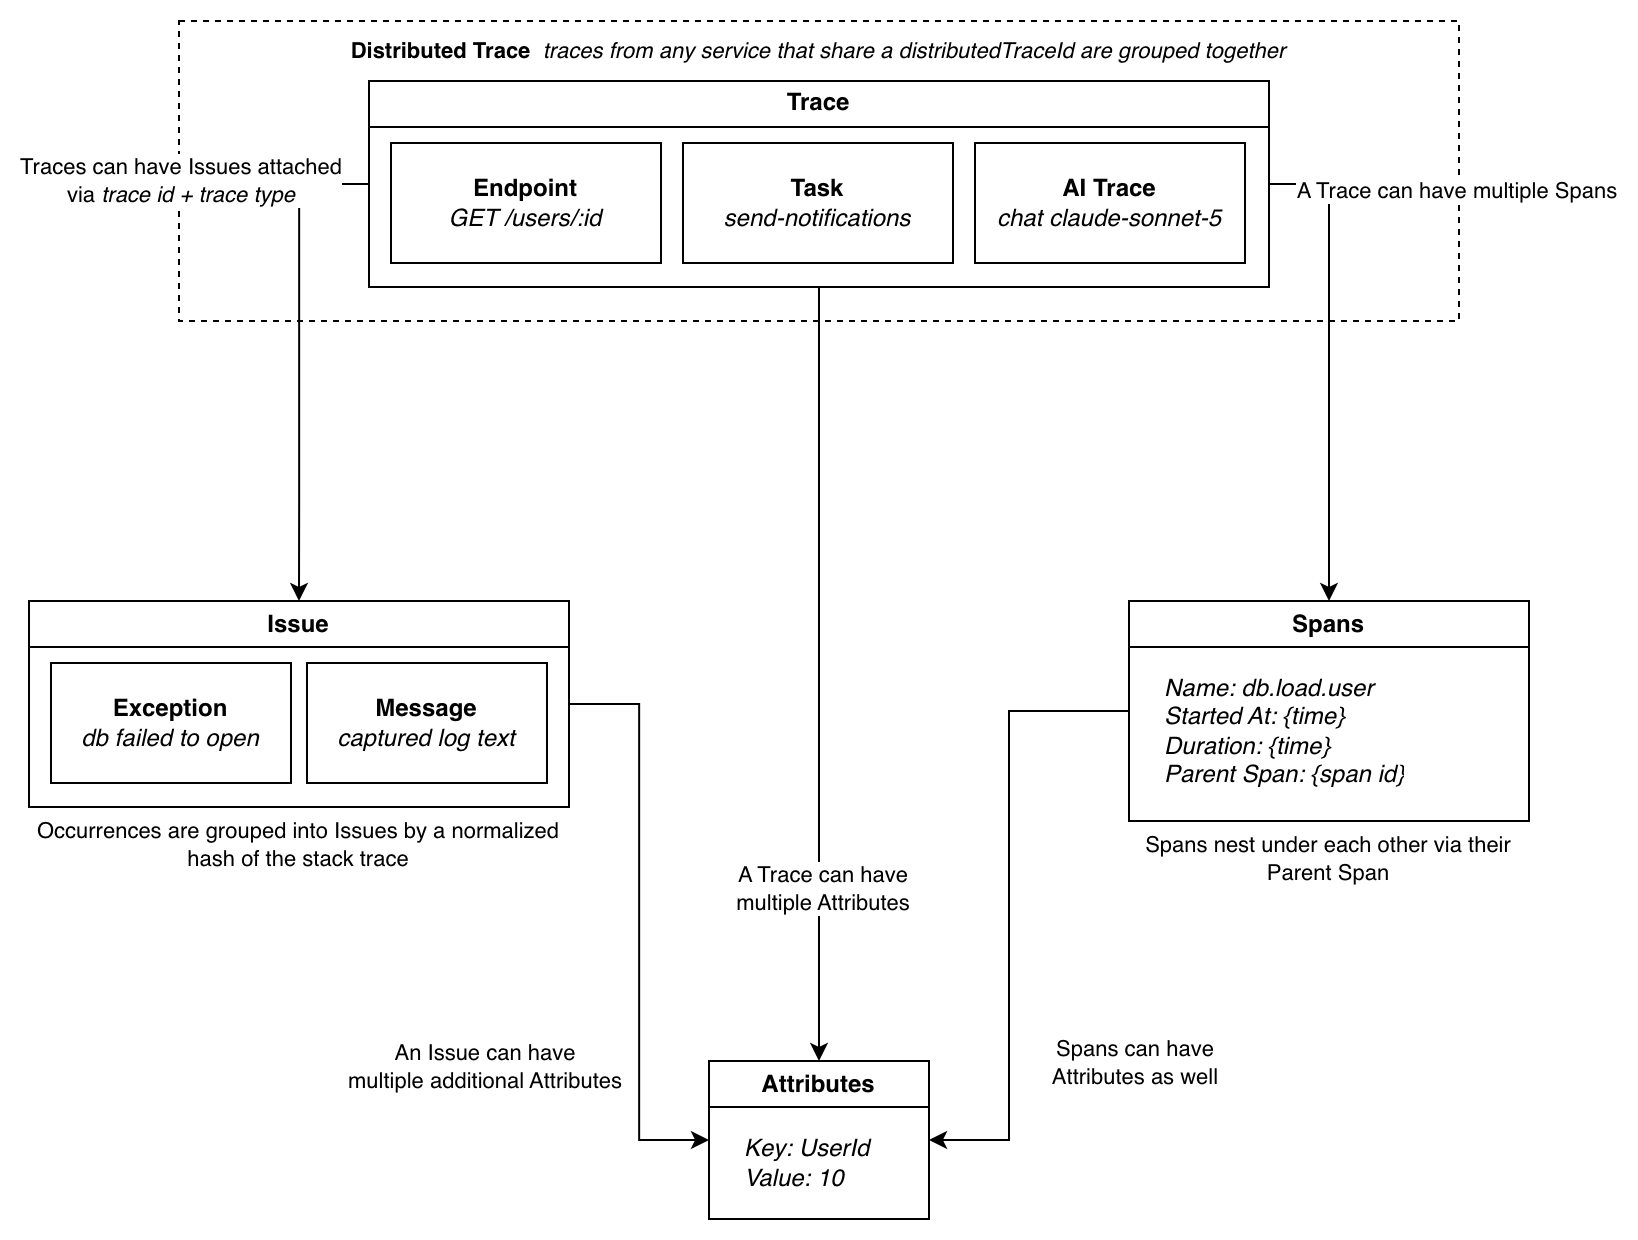
Every piece of trace data Traceway ingests is an OpenTelemetry span. Spans carry a name, a kind, a duration, attributes, events (exceptions live here), and parent/trace ids. The shape is OTel-native: Traceway speaks OTLP directly and doesn't impose its own trace model on top.
The materialized views
On ingestion, Traceway classifies each span and writes a row into a dedicated table when the kind or attributes match a rule. These tables are the top-level dashboard concepts:
- Endpoints: inbound HTTP entry points (
GET /api/users/:id). - Tasks: queue consumers, scheduled commands, anything that runs as a "thing that completes".
- AI Traces: any span carrying
gen_ai.*attributes, root or child. - Issues: exception events lifted off whichever entity owned the span.
Each table is indexed and shaped for one job: answering "what's slow?", "what's expensive?", "what's failing?" without scanning the full span store. They're projections, not parallel universes: the underlying span data is the source of truth.
Trace classification rules and the views → · Issues → · AI Tracing →
Root and non-root entities
Endpoints, Tasks, and AI Traces all carry an is_root flag. A row is non-root when the span that produced it was a child of another span: a queue worker started by an HTTP request, an LLM call made inside that same handler, a downstream service hop. Non-root rows link back to the originating trace via their traceId, so the distributed-trace view shows the full picture across all the entities that share one OTel trace id.
Enrichments
- Attributes: key-value metadata on spans and the entities derived from them. Flow from global → per-request scope. Details →
- Sessions: user-session grouping for browser/mobile clients, separate from traces. Details →
- Metrics: time-series measurements, ingested via OTLP metrics. Independent of the trace pipeline. Details →
- Logs: OTLP logs ingestion, joinable to traces by trace id. Details →
See Data Flow for how these connect during request processing, task execution, and metrics collection, and Project Structure for how to split an application across Traceway projects before you instrument it.
Above a single project
Everything above is scoped to one project. The Organization Overview sits above them all: every server reporting into the organization, every recently active issue, every monitor, and every open on-call page, each one a sidebar click apart. It is how a fleet of servers or a Kubernetes cluster is read at a glance before you drill into the project that owns the problem.
Authentication
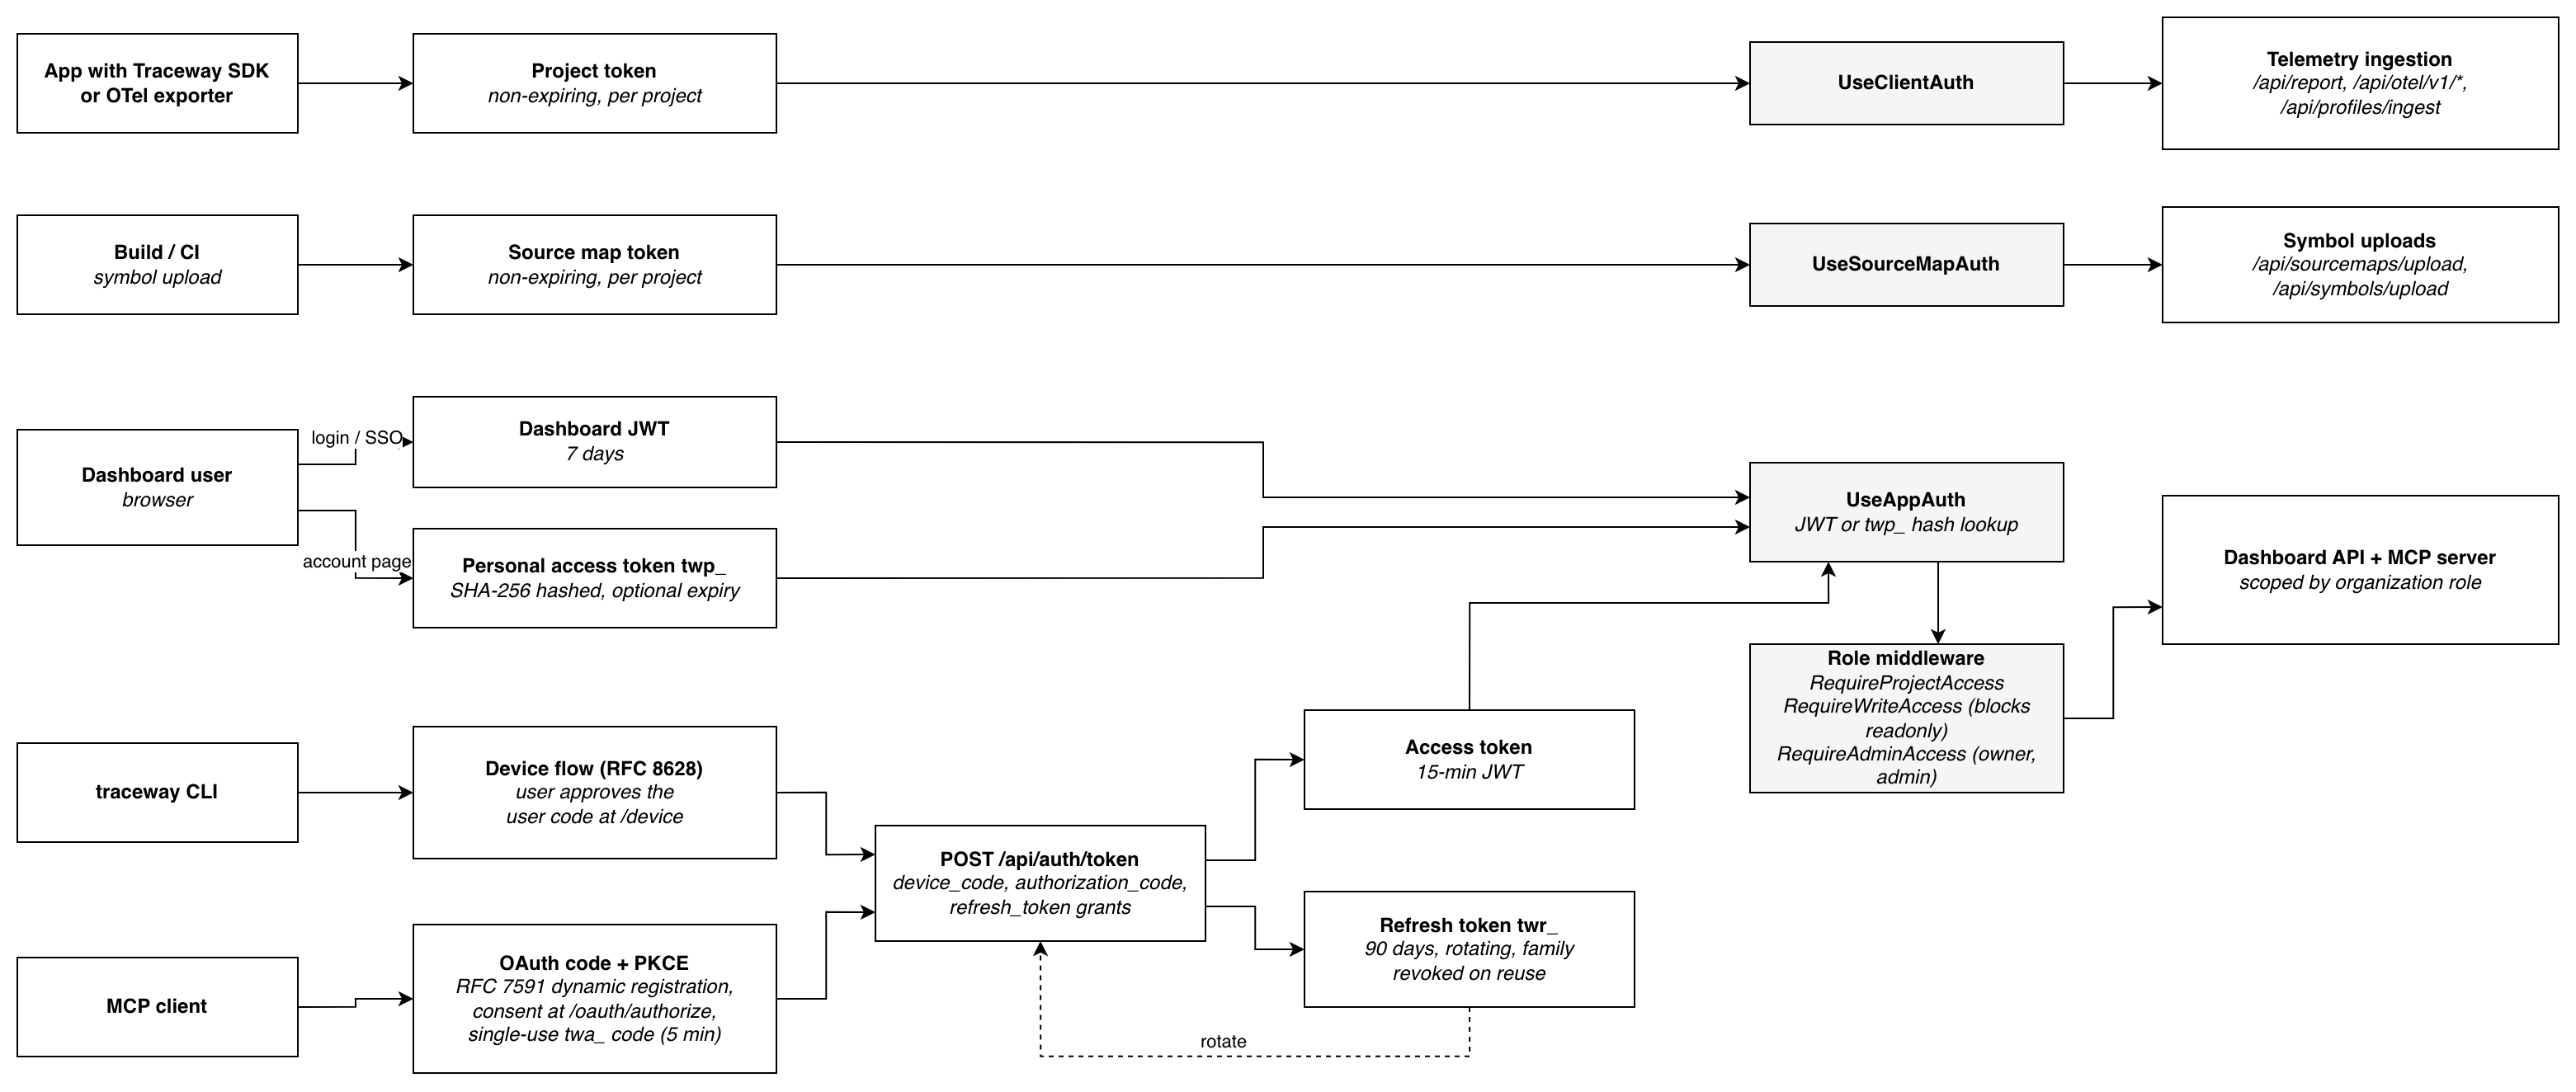
Every way in has its own credential: SDKs and OTel exporters use the project token, CI uses the source map token for symbol uploads, the dashboard uses a JWT or a personal access token, the CLI uses a device flow, and MCP clients use OAuth with PKCE. Role middleware scopes what an authenticated user can do.