Organization Overview
Every other page in Traceway is scoped to one project. The organization pages are the ones that are not: they put every server, issue, monitor, and open on-call page across all of your organization's projects one sidebar click apart.
They answer the questions a project view cannot. Which box is about to run out of memory? What is already paging someone? Is anything on fire anywhere?
Getting there
Open the switcher in the top-left header. Organizations are the headings; their projects are listed underneath. Selecting the organization itself opens its pages, selecting a project opens that project's dashboard.
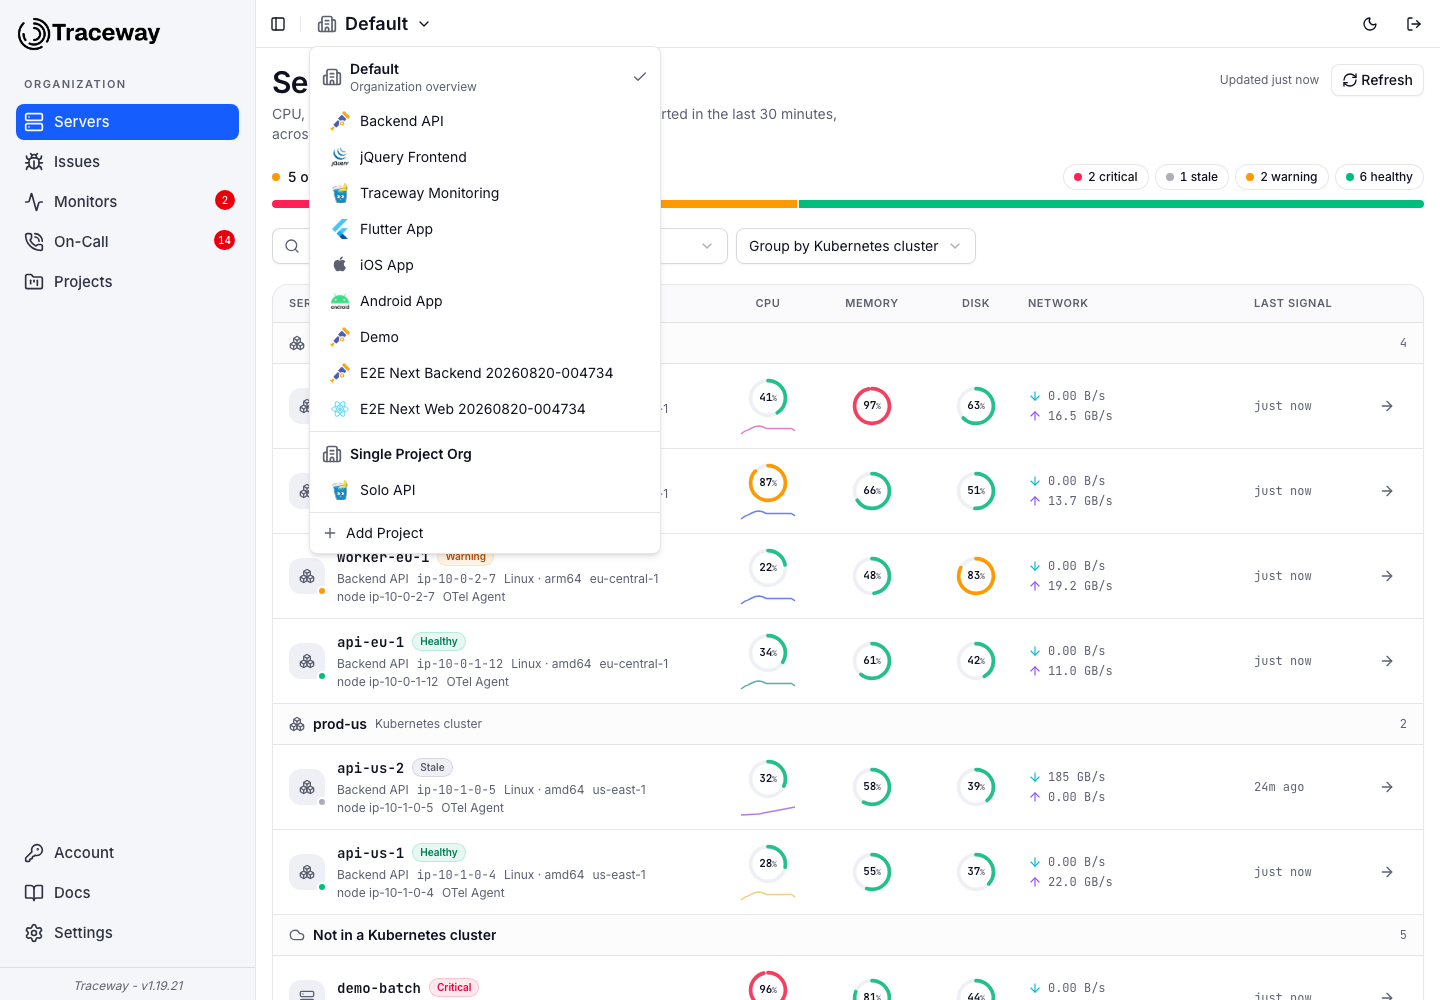
The sidebar stays where it is and switches to the organization's pages, under an Organization label: Servers, Issues, Monitors, On-Call, and Projects. Each one fans out over all of the organization's projects. The Monitors badge counts monitors currently down and the On-Call badge counts open pages, across the whole organization. Pick a project from the switcher, or select a row on any of the pages, to get back into a project.
After signing in you land on the Servers page automatically when your first organization has more than one project. With a single project you go straight to that project's dashboard, since an overview of one thing is not worth a click. That organization has no organization pages at all: the switcher lists it as a plain heading, and opening /organization for it sends you into the project.
The sidebar also adapts to what the organization contains. Servers and monitors are backend features, so when every project is a browser or mobile app the Servers and Monitors items disappear and Issues becomes the first page.
Every organization member can open these pages, read-only members included. They show the projects you can already see, so they grant no access you did not have.
The pages are per organization, not global. If you belong to more than one, each has its own set; switch between them from the same menu.
Servers
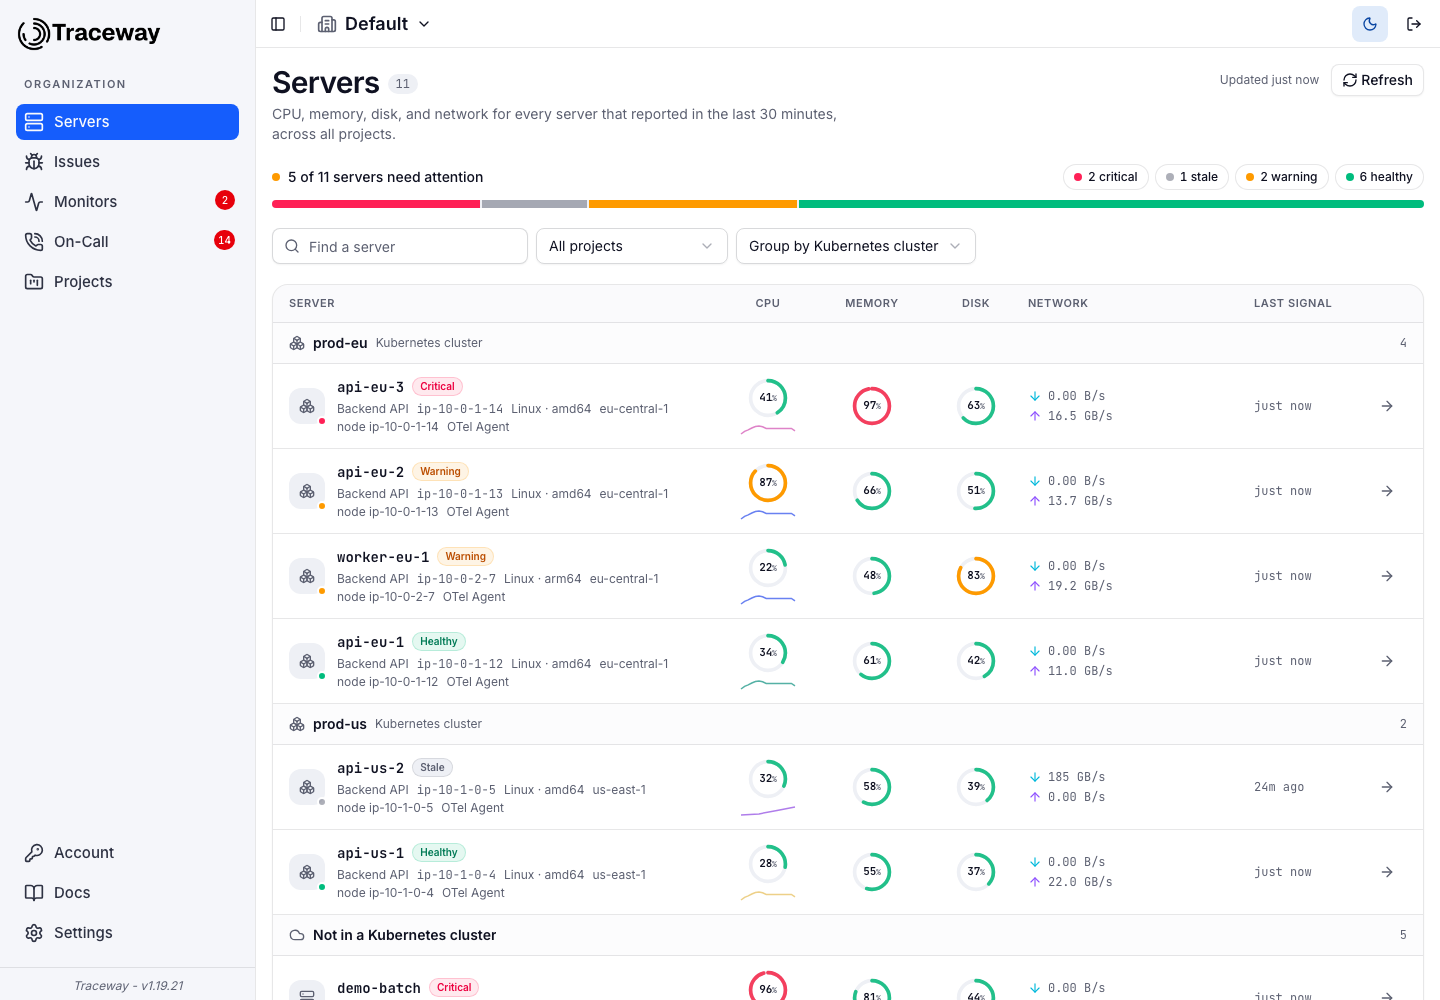
The Servers page is a live view of every server reporting into the organization over the last 30 minutes. One row per distinct server_name, per project.
Rows come from server metrics, not from any registry, so a server appears when it starts reporting and disappears when it stops. Nothing to register, nothing to clean up.
Fleet health
The bar under the title is the summary you read first: one segment per health state, sized by how many servers are in it, worst first. The line above it says how many servers need attention, and the chips beside it carry the counts. Selecting a chip filters the table to that state; select it again to clear the filter.
The page refreshes itself every minute, and Refresh forces it. A refresh that fails leaves the last good snapshot on screen with a warning rather than blanking the page, and on every organization page, if one project's telemetry cannot be read the others still render with a notice.
Columns
| Column | Source |
|---|---|
| CPU | system.cpu.utilization where state=idle, inverted, with a 30-minute sparkline |
| Memory | system.memory.utilization where state=used |
| Disk | system.filesystem.utilization where state=used |
| Network | system.network.io split by direction, as a rate |
| Last signal | Most recent metric point from that server |
Hosts running the Traceway OTel Agent or any OpenTelemetry Collector with the hostmetrics receiver fill in all four. Servers still on the older Traceway Go SDK metric names (cpu.used_pcnt, mem.used, mem.total) fill in CPU and memory, and the row is labelled SDK metrics instead of OTel Agent.
The three system.*.utilization metrics are off by default in the
OpenTelemetry hostmetrics receiver. If you configure a collector by hand,
enable them explicitly or the rings stay empty. The Traceway OTel Agent and
the Kubernetes manifests already do.
Health states
Each row carries a state, computed from the latest values:
| State | Condition |
|---|---|
| Critical | CPU ≥ 95%, memory ≥ 95%, or disk ≥ 90% |
| Warning | CPU ≥ 80%, memory ≥ 85%, or disk ≥ 80% |
| Stale | No metric in the last 3 minutes, whatever the last values were |
| Healthy | Everything else |
Rows sort worst-first inside their group, and the health bar reads the same way: critical, then stale, then warning, then healthy. Stale outranks warning deliberately. A server that stopped talking is a bigger unknown than one running warm.
The metadata line
Under each server name is whatever the telemetry knows about it: the project, the host name when it differs from the server name, OS and architecture, cloud region, the Kubernetes node, and whether the numbers came from the OTel Agent or the SDK. All of it comes from resource attributes on the metrics themselves (see Resource Attributes), so richer instrumentation means a more useful line, and nothing needs configuring in Traceway.
Search, filter, group
- Find a server matches the server name, project, host name, host id, OS, architecture, cloud region, Kubernetes cluster, and node name.
- Health chips narrow to critical, stale, warning, or healthy servers.
- Project appears once servers span more than one project.
- Group by switches between project, Kubernetes cluster, and no grouping.
Grouping defaults to project. When any server carries a k8s.cluster.name attribute, the page starts grouped by Kubernetes cluster instead, and servers without one collect under Not in a Kubernetes cluster. See Kubernetes for how that attribute gets set.
Clicking through
Selecting a row opens that server's dashboard: the project's dashboards page, scoped to that one server_name, over the last 30 minutes. If the project has the OTelemetry Server Agent dashboard installed, that tab opens directly.
The scope is a normal URL parameter (?server=<name>), so the link is shareable and the page keeps the filter while you change the time range. Clear it from the instance picker in the dashboard header. See Dashboards.
Issues
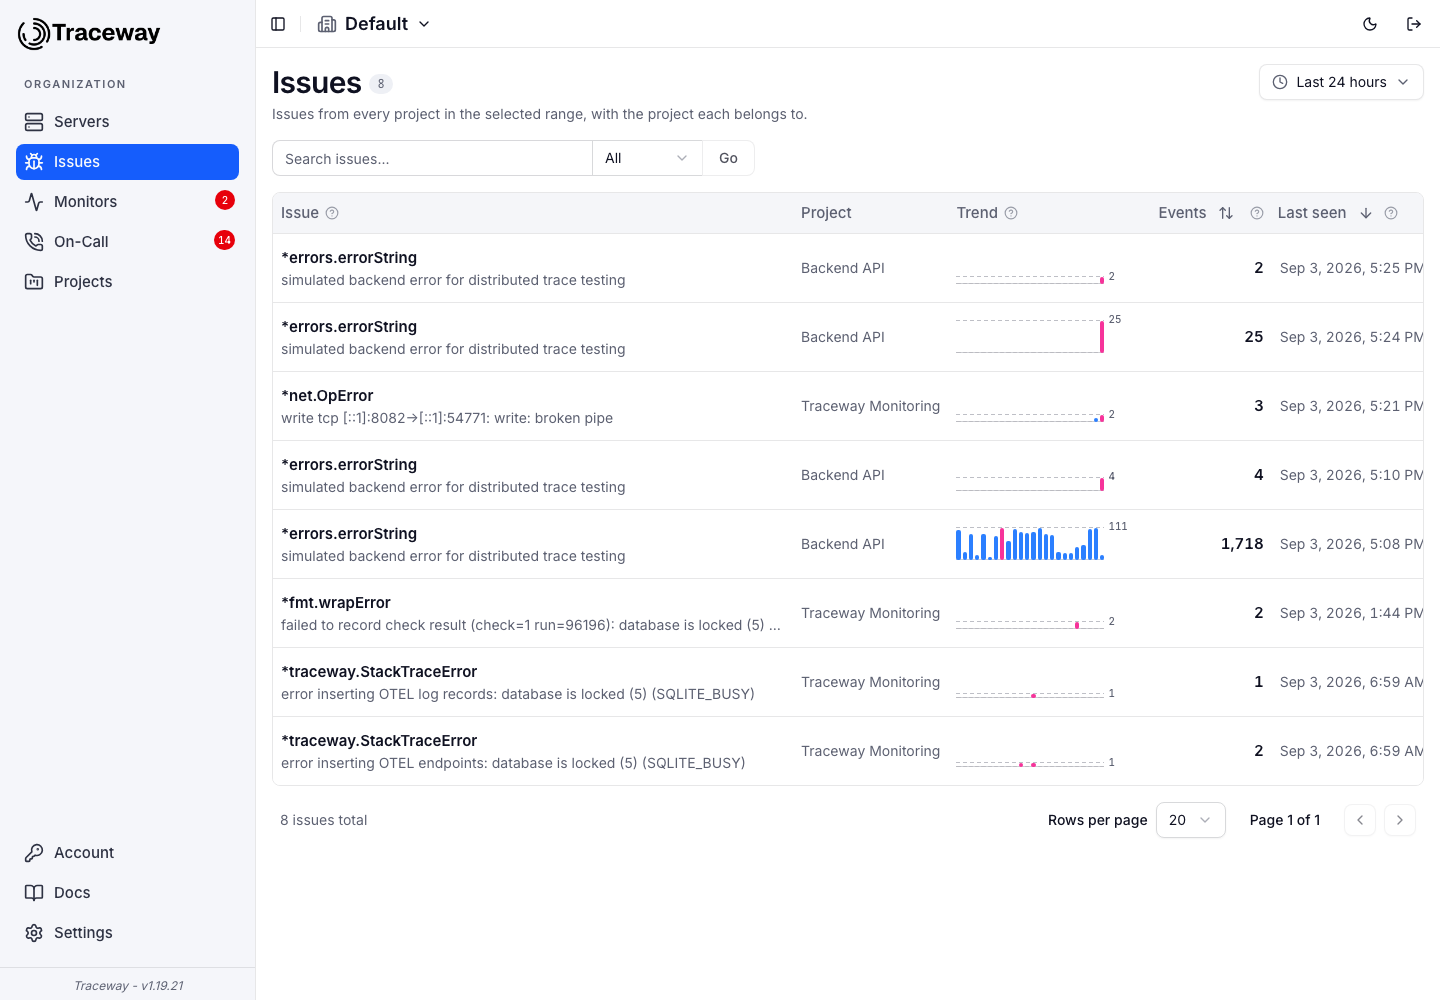
Issues from every project in the selected time range, with the project each belongs to. The page works like the project-level Issues page: a time range picker (last 24 hours by default), a search box that matches issues, messages, or both, sortable Events and Last seen columns, and pagination. The counter next to the title is the total across the organization for that range. Every project contributes its own top groups and the page is cut from their merged order, so a page here is exactly what one combined project would show. Selecting a row opens the issue in its project, where you archive it.
Monitors
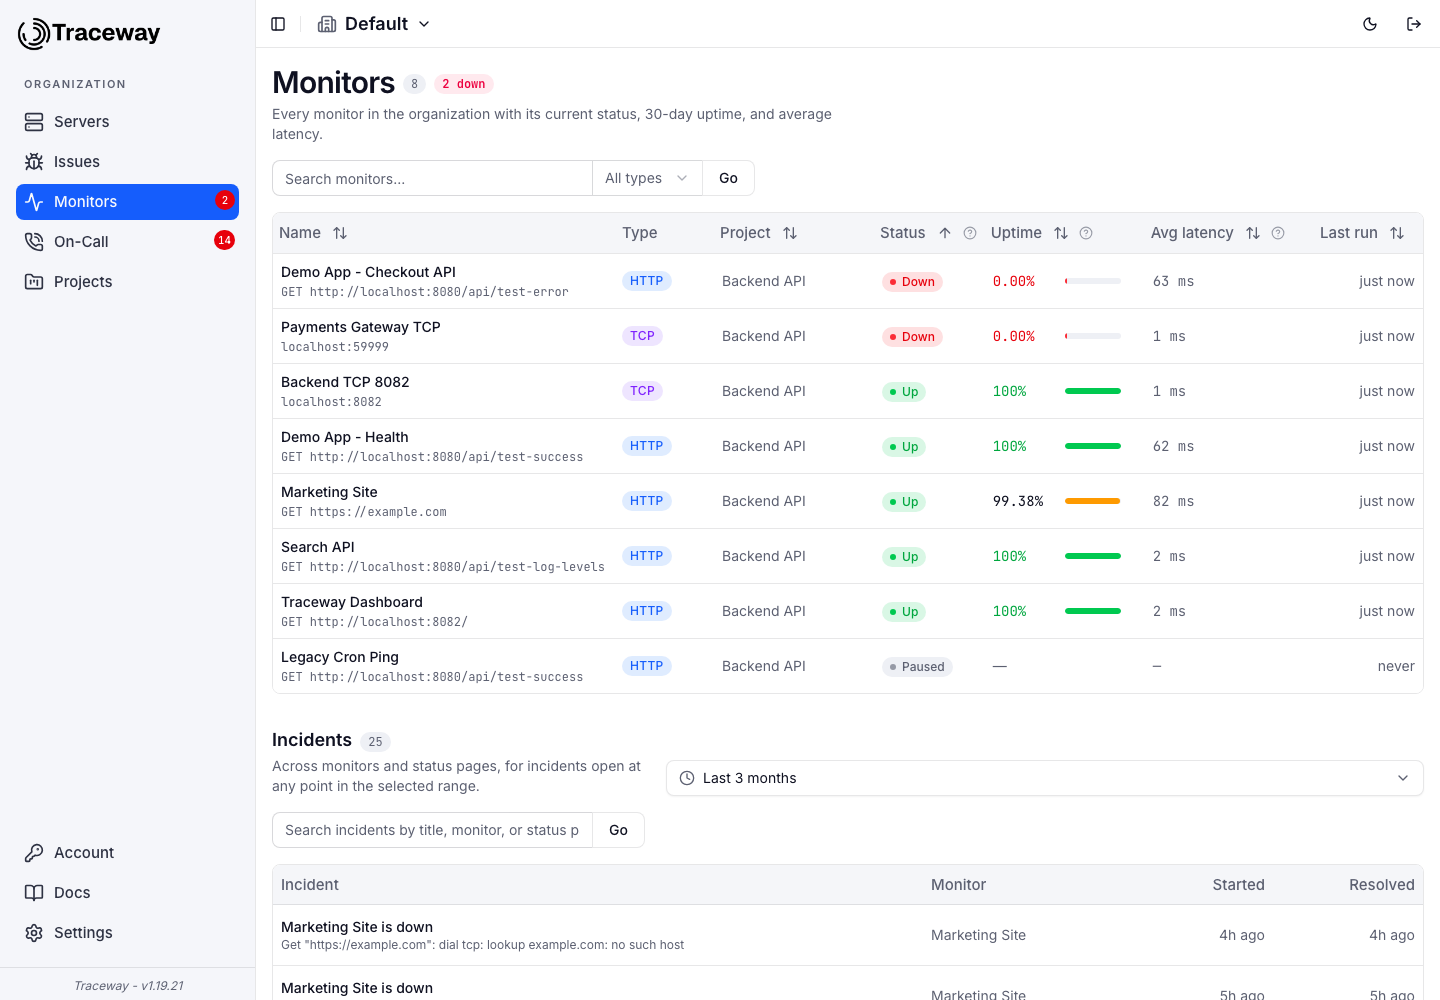
Every monitor in the organization in one sortable list: type, project, current status, 30-day uptime, 30-day average latency, and last run. Search narrows the list by name, project, or target, and the type dropdown keeps only HTTP, TCP, or browser monitors. The counters next to the title show how many monitors there are and how many are down right now. Monitors deliberately carry no time filter, like the project page.
Underneath is the organization's incident history across monitors and status pages, with its own time range picker (last 3 months by default), a search over title, monitor, status page, and error message, and pagination. An incident is listed when it was open at any point in the range, so the ongoing ones are always there, marked as such.
Uptime excludes missed probes, so a window where Traceway itself was down reads as unknown rather than as a fabricated 100%.
On-Call
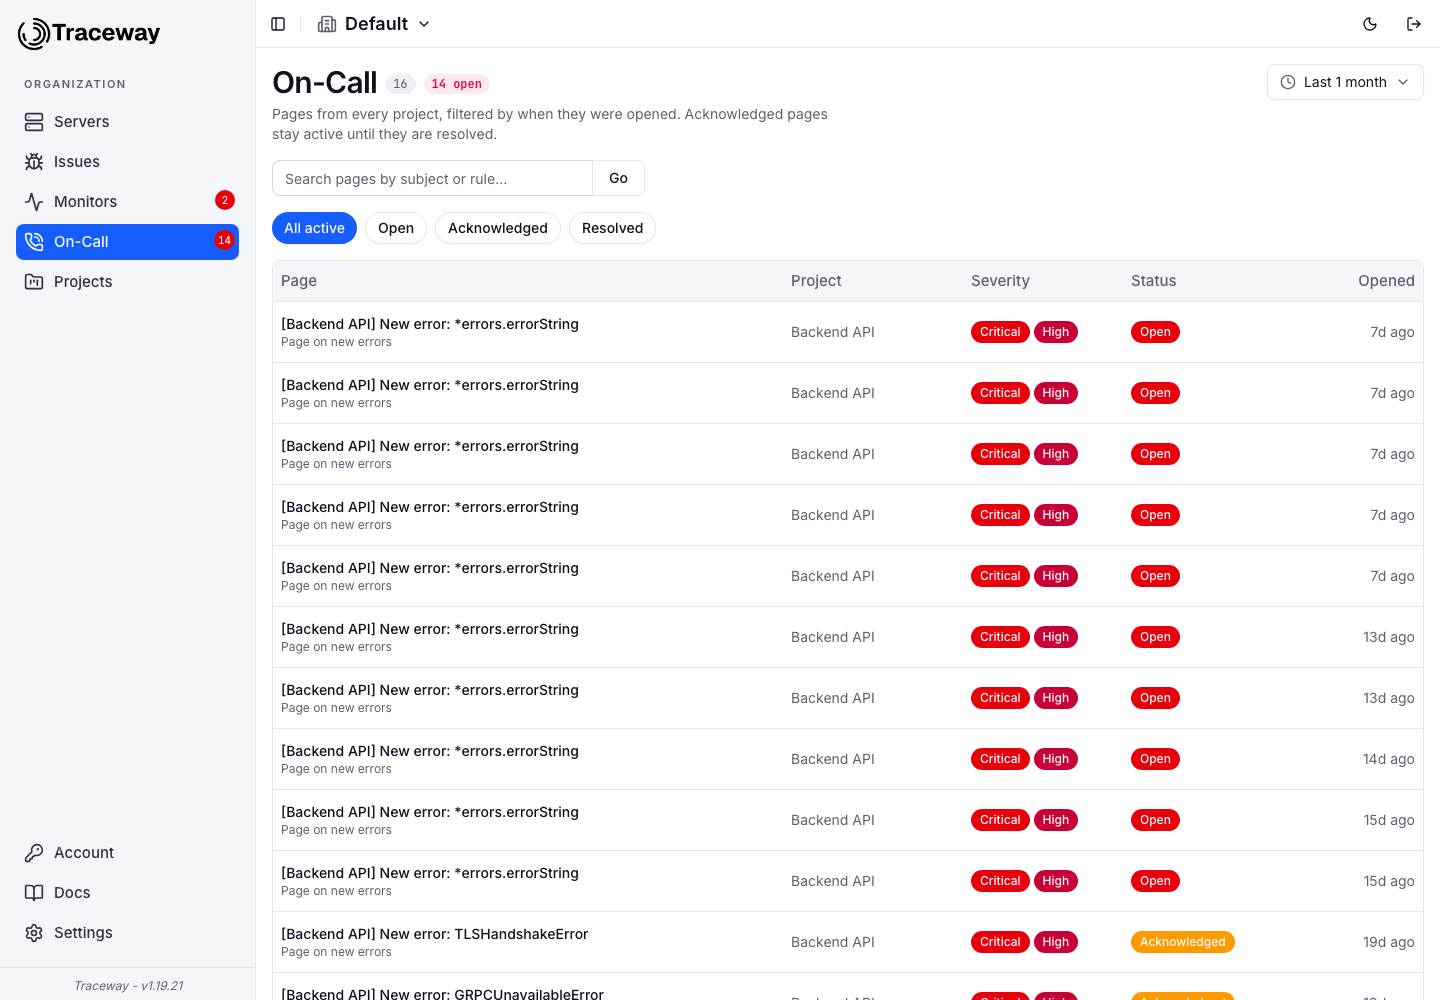
Pages from every project: title, project, severity, status, and when each was opened. It is the same queue as the On-Call page, without the per-project filter, and it refreshes itself every minute. The status chips switch between all active, open, acknowledged, and resolved pages; the search box matches subject and rule name; the time range picker filters by when a page was opened and defaults to the last month, wide enough that an ageing open page does not quietly fall off the screen. Acknowledged pages stay active until they are resolved. Selecting a row opens the page in its project.
Projects
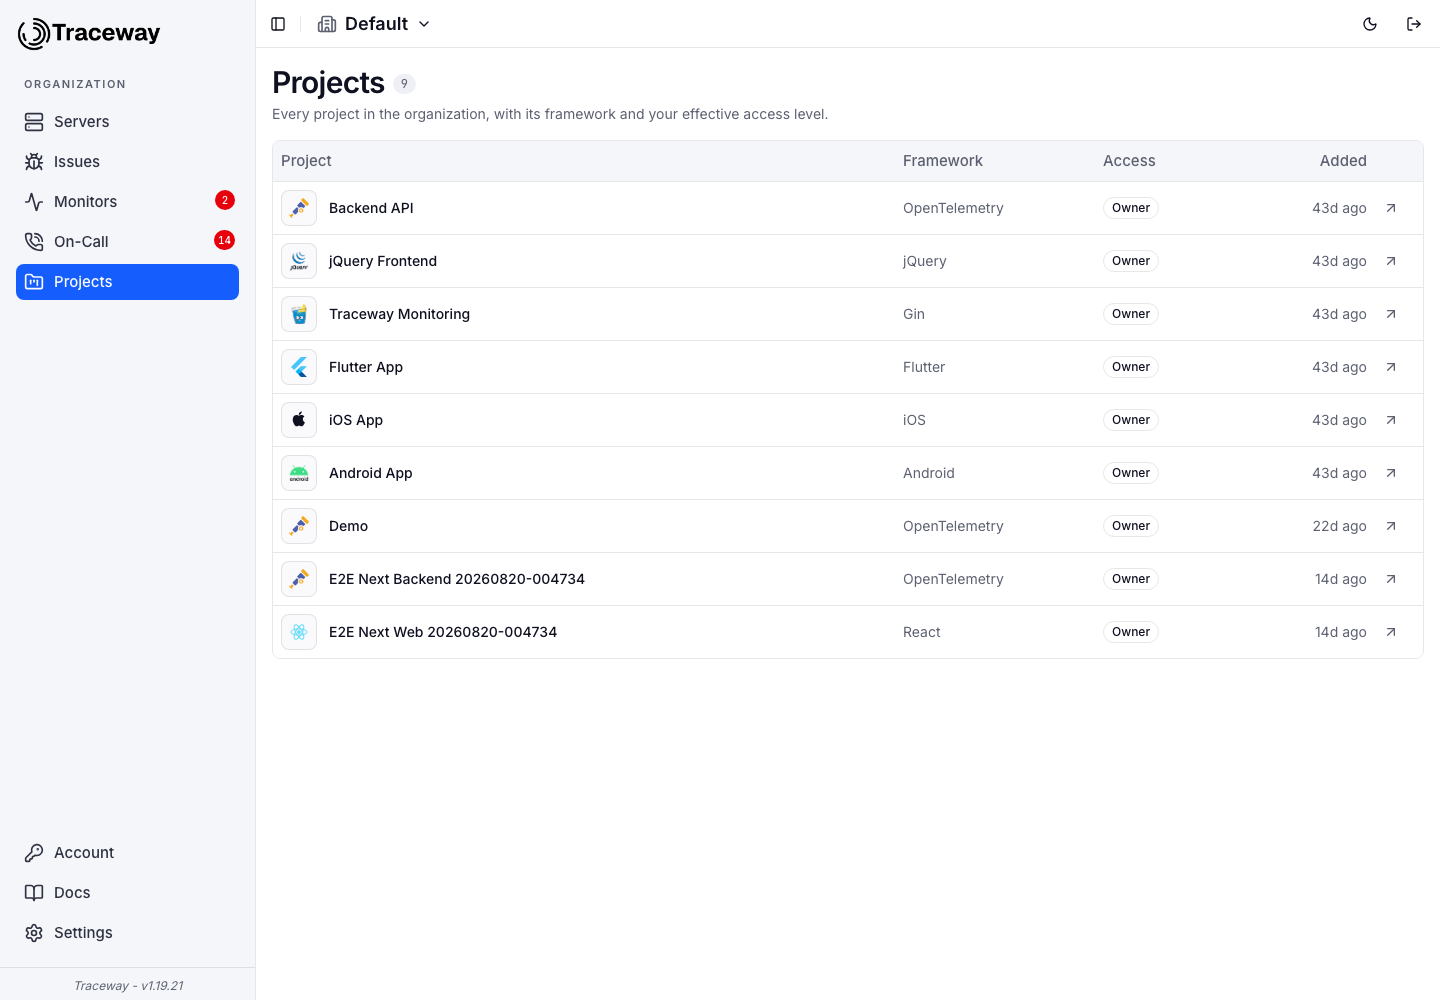
Every project in the organization with its framework, when it was added, and your effective access level on it: your organization role, unless a per-project override changes it. Selecting a row opens that project.
Multi-organization setups
A user can belong to several organizations, and each carries its own organization pages, members, dashboards, teams, schedules, and escalation policies. Nothing is shared across the boundary, which is what makes an organization the right shape for an agency's clients or a company's independent business units.
Within one organization, prefer more projects over more organizations. Projects are the isolation boundary for telemetry, but the organization pages, dashboards, on-call rotations, and status pages are all organization-wide, so splitting a fleet across organizations means giving up exactly the view that makes a fleet manageable.
Next steps
- Kubernetes for cluster-wide instrumentation and cluster grouping
- Traceway OTel Agent for host metrics on a plain server
- Project Structure for splitting an application across projects
- On-Call for the paging that fills the response queue