Monitors
Monitors answer the question your telemetry cannot: is the service actually reachable from the outside? Traces and logs only exist while requests arrive. A monitor keeps probing on a schedule, so you find out your site is down before a user tells you.
They live under Monitors in the sidebar, with tabs for the monitors themselves, Status Pages, and Post-Mortems. The badge counts the monitors currently down on the current project. Every monitor across all of the organization's projects, with uptime, latency, and incident history, is on the Organization Overview.
Check types
- HTTP probes a URL like Postman would: method, headers, auth (basic, bearer, or a custom header), request body, and a set of expected results. You can assert on status codes, response body content (substring or regex), a maximum response time, and a minimum number of days before the TLS certificate expires. With no status assertion, anything below 400 counts as up.
- TCP connects to a host and port, optionally over TLS, optionally sending a payload and asserting on the response. Useful for databases, SMTP, or anything that is not HTTP.
- Browser runs a real @playwright/test (opens in a new tab) script in headless Chromium. You write the spec in a code editor right on the check, so a login flow or a checkout journey can be your uptime probe. Failed runs automatically store a screenshot and the Playwright output; both open from the run history (the screenshot and logs links).
Every check has an interval (30 seconds to 24 hours), a timeout, and a failure threshold. The threshold is flap damping: a check only transitions to down after that many consecutive failures, so one flaky probe does not page anyone at 3am.
How runs work
A scheduler enqueues each due check into a durable run queue in the main database, and executors claim runs from it. Results land in the telemetry store, so uptime and latency charts use the same retention and aggregation machinery as everything else.
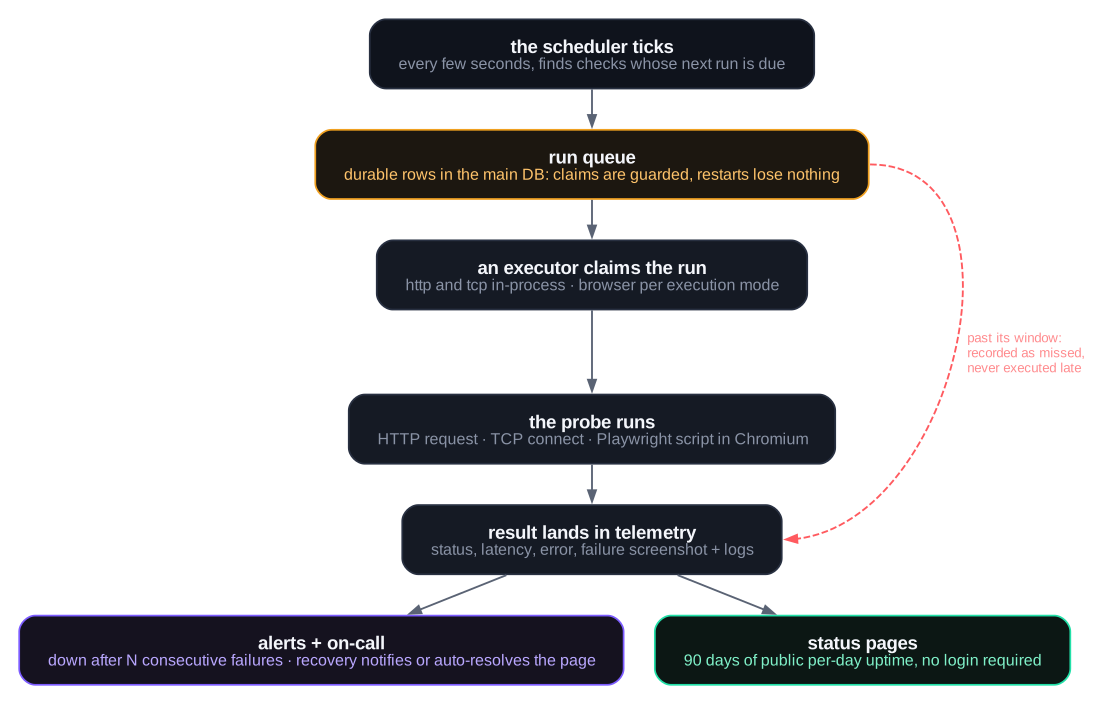
Two properties matter operationally:
- A probe never runs late. A queued run that outlives its window (the check's interval, capped at five minutes) is recorded as
missed, not executed. A stale "is it up" answer would corrupt the uptime timeline. - Downtime of Traceway itself shows as a gap, not as uptime. If the backend was off, no runs existed, and the charts show unknown rather than a fabricated 100%.
Alerting
Add a notification rule of type Monitor Down on the Alerts page. It fires when any monitor in the project crosses its failure threshold, and sends a recovery notice when the check comes back. Pointing the rule at an escalation channel opens an on-call page instead; the page deduplicates per check, and recovery resolves it automatically, so a blip at night that recovers by itself never needs a human.
Status pages
A status page publishes the uptime of selected monitors at /status/<slug>: a branded light page with 90 days of per-day uptime bars (green operational, amber partial outage, red major outage, gray no data), incident history, and no login required. Create one under the Status Pages tab on the Monitors page (organization admins only), pick the monitors, choose a slug, and toggle it public. Branding: a title, an optional description, and an uploaded PNG/JPEG logo. Latency numbers stay internal; the public payload only carries availability.
Serving a status page on your own domain
Every public status page is always available at /status/<slug> on your Traceway instance. On Traceway Cloud that is https://cloud.tracewayapp.com/status/<slug>. To show it on a domain of your own, such as status.acme.com, there are two paths:
| Path 1: CNAME | Path 2: iframe | |
|---|---|---|
| Works on | Self-hosted Traceway | Traceway Cloud and self-hosted |
| What you host | Nothing, DNS points at Traceway | One static HTML file |
Who provides HTTPS for status.acme.com | A reverse proxy with SSL in front of Traceway, such as Cloudflare | Whatever hosts the HTML file |
| Custom domain field on the status page | Set to status.acme.com | Left empty |
Both paths need the status page to be public.
Path 1: CNAME to your Traceway instance
Use this when you run Traceway yourself. Traceway does not handle HTTPS itself, so this path needs a reverse proxy with SSL in front of it. That proxy holds the certificate for status.acme.com and forwards requests to Traceway. Traceway Cloud does not issue certificates for your hostnames, so on Cloud use path 2.
Any of these proxies works:
- Cloudflare. Put
status.acme.comon Cloudflare and turn the proxy on for the record (the orange cloud). Cloudflare serves the certificate to visitors. Your server still has to answer HTTPS for Cloudflare's connection: with SSL/TLS set to Full any certificate is accepted, and with Full (strict) install a Cloudflare Origin CA certificate that coversstatus.acme.com. - Caddy or Traefik on your server. Both issue a Let's Encrypt certificate for the new hostname automatically.
- nginx on your server, with a certificate from certbot.
Then:
- Set Custom domain on the status page to
status.acme.com. - Create a DNS CNAME record from
status.acme.comto your Traceway instance's hostname. - Add
status.acme.comto your reverse proxy with its certificate. The proxy must pass the originalHostheader through, since that is how Traceway recognizes the domain. Cloudflare, Caddy and Traefik do this by default. With nginx, setproxy_set_header Host $host;.
Anyone who opens https://status.acme.com sees the status page at /, whether or not they are logged in to Traceway. The dashboard is never served on a status domain, and every other path redirects to /. The custom domain can't be the hostname Traceway itself runs on.
Path 2: embed the page in an iframe
Use this on Traceway Cloud, or on a self-hosted instance when you would rather not touch the proxy. Status pages are allowed to be framed by any site, so you host one small HTML file that fills the whole window with the status page.
- Leave Custom domain empty on the status page and note its slug.
- Save the file below as
index.htmland replaceacmewith your slug. On a self-hosted instance, also replacehttps://cloud.tracewayapp.comwith your own Traceway URL. - Host it at
status.acme.comon any static host with HTTPS, such as Cloudflare Pages, Netlify, GitHub Pages, or an S3 bucket behind CloudFront.
<!doctype html>
<html lang="en">
  <head>
    <meta charset="utf-8" />
    <meta name="viewport" content="width=device-width, initial-scale=1" />
    <title>Acme status</title>
    <style>
      html,
      body {
        margin: 0;
        padding: 0;
        width: 100%;
        height: 100%;
        overflow: hidden;
      }
      iframe {
        display: block;
        width: 100%;
        height: 100%;
        border: 0;
      }
    </style>
  </head>
  <body>
    <iframe src="https://cloud.tracewayapp.com/status/acme" title="Acme status"></iframe>
  </body>
</html>
The iframe takes the full window with no padding or border, and the status page scrolls inside it. The page keeps refreshing on its own, so the file never needs to change. Search engines and link previews see only this file, so set its <title> to something meaningful.
Incidents and post-mortems
Monitors feed a full incident-management workflow, covered in depth in Incidents & Post-Mortems:
- Incidents open and resolve themselves from monitor state transitions, with an automatic Investigating and Resolved timeline. Outages your monitors missed can be recorded by hand on a status page, backdated if needed; manual incidents never change uptime numbers.
- The public story is yours to tell. Give incidents public titles and post statuspage-style timeline updates (Investigating, Identified, Monitoring, Update, Resolved). The last 90 days appear in the Past Incidents section of the public page; probe error messages stay internal.
- Post-mortems are internal write-ups in the Post-Mortems tab, owned by the project like the monitors themselves: a WYSIWYG markdown editor with a raw-markdown toggle, tags, an optional link to the incident (one per incident), a full edit activity log, and search across titles, content, and tags. They never appear on public status pages.
Browser execution modes
Browser checks execute real user-authored JavaScript, so where that code runs is an explicit deployment decision, controlled by SYNTHETICS_BROWSER_MODE:
| Mode | What it means |
|---|---|
off (default) | HTTP and TCP checks only. Works in every image with no size cost; creating a browser check is rejected with a pointer here. Existing browser checks stay editable and pausable, and simply do not run until a browser mode is enabled. |
embedded | The backend spawns Playwright in-process. Ships ready to go in the :browser image, or without Docker on any host with Node and a Playwright harness. |
remote | The backend only queues browser runs; one or more runners claim and execute them. |
Runners are deployment infrastructure, managed by whoever operates the server, not by dashboard users. There is nothing to create in the UI: set a shared secret on the server (SYNTHETICS_RUNNER_SECRET, required for remote mode) and start the traceway-runner binary anywhere with outbound HTTPS. Each runner self-registers under its name on first poll and only makes outbound connections (long-polling), so it works behind NAT with no inbound port. Work distributes itself: an idle runner claims the next queued run, a busy one is not asking, so adding capacity is just starting more runners. Rotate the fleet credential by changing the secret and restarting the runners.
The Remote Runners guide walks through the whole setup: getting the binary, preparing the Playwright harness, a systemd unit, verifying the runner is attached, and operations like rotation, scaling, and per-runner self-monitoring via TRACEWAY_RUNNER_MONITORING.
Browser check scripts run with an allowlisted environment: they see the variables configured on the check, never the server's own environment. In embedded mode the scripts still execute inside the Traceway container as arbitrary code, which is the trade-off for one-container convenience; use remote mode to keep them off the box entirely. Browser checks are disabled in cloud mode.
Configuration
SYNTHETICS_POLL_SECONDS=15              # scheduler tick
SYNTHETICS_BROWSER_MODE=off             # off | embedded | remote
SYNTHETICS_HTTP_CONCURRENCY=8           # concurrent http/tcp probes
SYNTHETICS_BROWSER_CONCURRENCY=2        # concurrent Chromium instances (embedded)
SYNTHETICS_ALLOW_PRIVATE_TARGETS=true   # "false" refuses checks against private/LAN addresses
SYNTHETICS_PLAYWRIGHT_DIR=/opt/traceway-playwright   # harness dir (embedded/runner)
SYNTHETICS_SCREENSHOT_RETENTION_DAYS=30 # failure screenshots on local storage; 0 disables cleanup
SYNTHETICS_RUNNER_SECRET=               # shared runner credential; required for remote mode
When private targets are allowed (the default), HTTP probes honor the standard HTTP_PROXY/HTTPS_PROXY environment variables, so monitors work on instances that can only reach the internet through an egress proxy. With SYNTHETICS_ALLOW_PRIVATE_TARGETS=false the proxy is deliberately ignored: the private-address guard vets the exact address being dialed, and a proxy tunnel would blind it. On Traceway Cloud, checks can only target public addresses; the guard is always on there.
Check results follow the telemetry retention of your deployment (the SQLite/DuckDB retention worker, or a 90-day TTL on ClickHouse).
Monitoring the monitors
When self-monitoring is on (MONITORING_TRACEWAY_URL), the instance emits traceway.synthetics.* metrics every 10 seconds: queued, claimed, oldest_queued_sec, checks_down, runners_online, and executed.delta / missed.delta. A healthy fleet shows near-zero queue age, throughput on executed.delta, and zero missed.delta; alert on runners_online dropping to 0 in remote mode. /api/health/deep exposes the same numbers as a synthetics block; it is an operator endpoint gated by the HEALTH_DEEP_TOKEN deploy secret (unset disables it).