Kubernetes
Two OpenTelemetry Collector workloads cover an entire cluster: a DaemonSet on every node and one small Deployment for cluster-wide state. Together they give Traceway node health, pod resource usage, container logs, cluster state, and Kubernetes events, under one project token.
Ready-to-apply manifests live in the repository at examples/kubernetes (opens in a new tab).
What you get
| Workload | Reads | Shows up as |
|---|---|---|
traceway-node-agent (DaemonSet) | Host CPU, memory, disk, filesystem, network of each node | One server row per node, grouped by cluster |
traceway-node-agent | Kubelet node and pod resource usage | k8s.pod.* metrics for dashboard widgets |
traceway-node-agent | Every container's stdout and stderr | The Logs page, tagged with pod, namespace and container |
traceway-cluster-agent (Deployment) | Pod phases, deployment replicas, node conditions, allocatable resources | k8s.* cluster metrics |
traceway-cluster-agent | Kubernetes events | The Logs page: scheduling failures, OOMKilled, image pull errors |
| Your applications | Traces, exceptions, application metrics, logs | Endpoints, Issues, Tasks, AI Traces |
The applications keep their own instrumentation. The collectors describe the cluster the applications run on; they do not replace OpenTelemetry in the app.
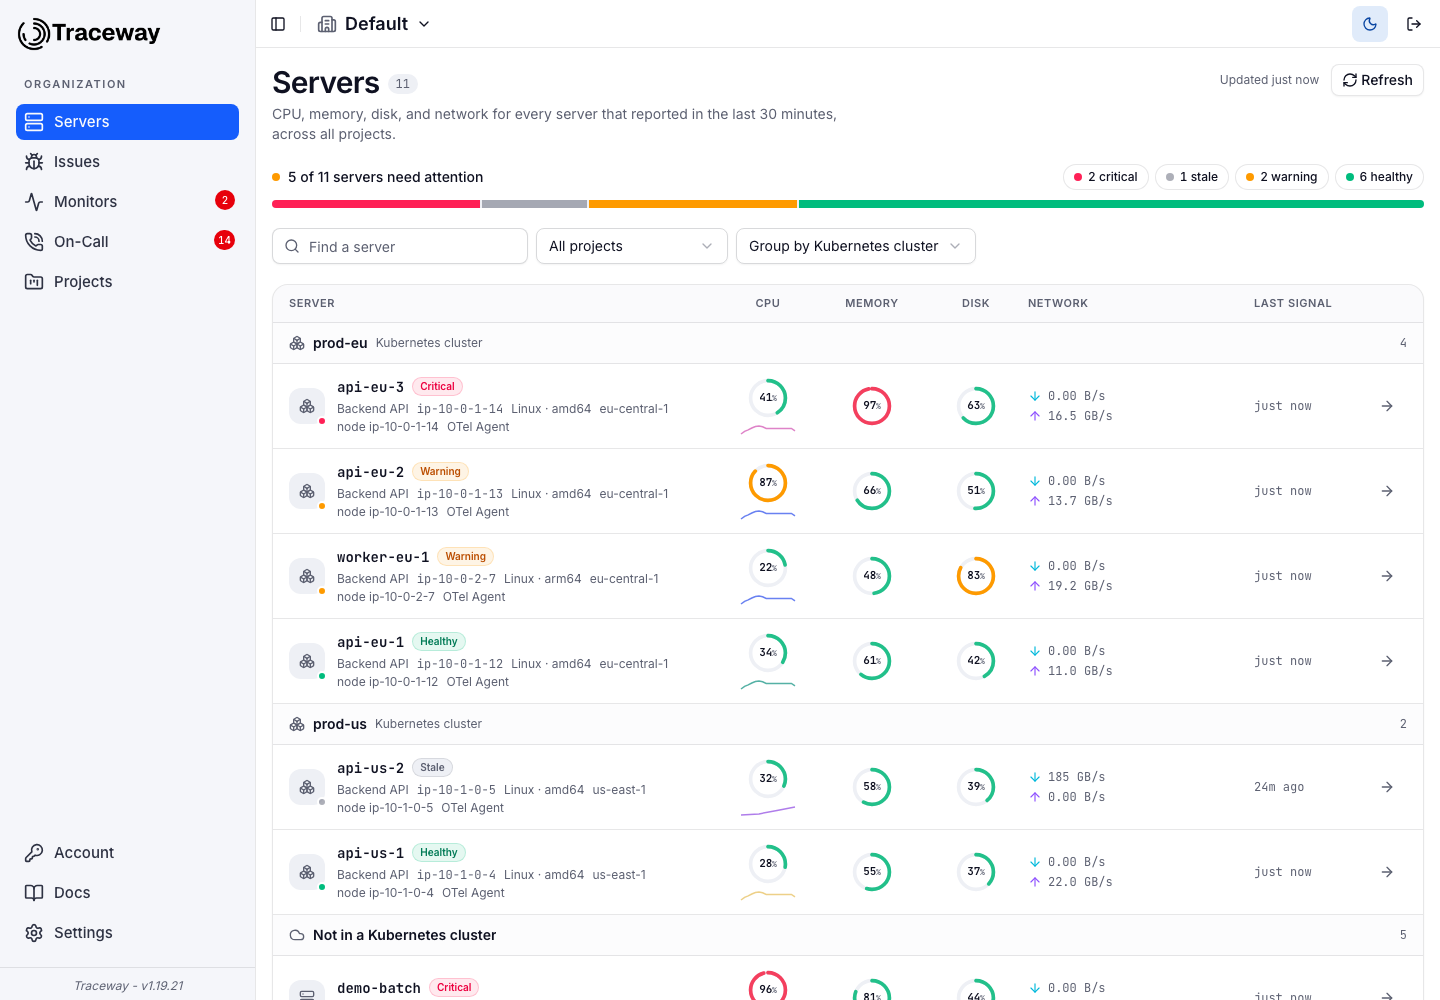
Nodes from every cluster and every plain host land in the same table, grouped by cluster. Machines with no k8s.cluster.name collect under Not in a Kubernetes cluster, so a half-migrated fleet still reads as one fleet.
Install
Pick the project
Cluster telemetry belongs in the same Traceway project as the backend running on it, exactly like host metrics on a plain server. See Project Structure for when to split. Copy the project token from Settings.
One project can hold several clusters. k8s.cluster.name keeps them apart in
the overview and in every widget that groups by it.
Create the namespace and the token secret
The token lives in a Secret rather than in the manifest, so the manifest stays safe to commit and to review.
kubectl create namespace traceway

kubectl create secret generic traceway-token \
  --namespace traceway \
  --from-literal=token='<your-project-token>'
Set the cluster name and endpoint
Download the manifest and edit the two values in the traceway-settings ConfigMap at the top of it:
curl -O https://raw.githubusercontent.com/tracewayapp/traceway/main/examples/kubernetes/traceway-kubernetes.yamldata:
TRACEWAY_CLUSTER_NAME: production-eu
TRACEWAY_ENDPOINT: https://traceway.mycompany.com/api/otelTRACEWAY_CLUSTER_NAME becomes k8s.cluster.name on everything the cluster reports, and it is the string the organization's Servers page groups servers by. Give every cluster a distinct one.
TRACEWAY_ENDPOINT is the OTLP/HTTP base URL of your instance, ending in /api/otel. On Traceway Cloud that is https://cloud.tracewayapp.com/api/otel. The collector appends /v1/metrics, /v1/logs and /v1/traces itself.
Apply
kubectl apply -f traceway-kubernetes.yamlEverything lands in the traceway namespace: a ServiceAccount with read-only cluster RBAC, the two collector configs, the DaemonSet and the Deployment.
Watch it come up
kubectl -n traceway rollout status daemonset/traceway-node-agent
kubectl -n traceway logs -l app.kubernetes.io/name=traceway-node-agent --tail=50
Metrics arrive within about 30 seconds. Open the organization's Servers page: every node appears as its own server, grouped under your cluster name.
With Helm
If you already run the upstream OpenTelemetry Collector chart, the same setup is two releases. The values files in examples/kubernetes/helm (opens in a new tab) use the chart's presets and add only what Traceway needs.
helm repo add open-telemetry https://open-telemetry.github.io/opentelemetry-helm-charts
helm repo update

helm upgrade --install traceway-node-agent \
  open-telemetry/opentelemetry-collector \
  --namespace traceway --create-namespace \
  --values node-agent-values.yaml

helm upgrade --install traceway-cluster-agent \
  open-telemetry/opentelemetry-collector \
  --namespace traceway \
  --values cluster-agent-values.yaml
The same traceway-token Secret and traceway-settings ConfigMap are expected.
The chart's hostMetrics preset wires up the scrapers but leaves
system.cpu.utilization, system.memory.utilization and
system.filesystem.utilization disabled, because that is the receiver's
default. Those three are exactly what the organization's Servers page reads. Both
values files turn them on; if you write your own, do the same or the instance
rings stay empty.
Naming: what becomes an instance
Traceway's identity for a reporting machine is the server_name tag, and server_name comes from the service.name resource attribute. Nothing else creates or names an instance.
The node agent therefore sets service.name to the node name:
resource/node:
  attributes:
    - key: service.name
      value: ${env:K8S_NODE_NAME}
      action: upsert
with K8S_NODE_NAME injected from the downward API (spec.nodeName). One node, one service.name, one instance row. Skip this and every node in the cluster reports under the collector's own service name and collapses into a single row.
The same rule is why applications must keep their own service.name. A pod exporting as checkout-api stays checkout-api in Endpoints, Issues and Tasks, whatever node it lands on. Pods are not instances in the overview; nodes are.
Which Kubernetes attributes survive
Traceway does not copy arbitrary resource attributes onto stored telemetry, because every distinct value multiplies the number of series it keeps. What it keeps depends on the signal:
| Signal | Kubernetes attributes kept |
|---|---|
| Metrics | k8s.cluster.name, k8s.pod.name, k8s.namespace.name, k8s.node.name, k8s.deployment.name, k8s.container.name, plus container.name, container.image.name, host.*, os.* and cloud.* (full list under Resource Attributes) |
| Logs | All of them. Log records store the whole resource attribute map |
| Traces | None. Spans keep only service.name and service.version |
That shapes how you instrument:
- Group metric widgets by
k8s.pod.name,k8s.node.name,k8s.namespace.nameork8s.deployment.name. All four are available as tags. - Filter logs by any Kubernetes attribute; they are all in the record.
- Do not expect pod names on spans. If a trace needs to carry which pod served it, set it as a span attribute in the application, not as a resource attribute.
service.nameis what distinguishes services on the trace side.
Application telemetry
Applications in the cluster export OpenTelemetry as they normally would. Two ways to wire it:
Each deployment carries the project token and points at the instance. Secrets are namespaced, so create one in every namespace that reports:
kubectl create secret generic traceway-otlp -n checkout \
--from-literal=headers='Authorization=Bearer <your-project-token>'env:
- name: OTEL_EXPORTER_OTLP_ENDPOINT
value: https://traceway.mycompany.com/api/otel
- name: OTEL_EXPORTER_OTLP_HEADERS
valueFrom:
secretKeyRef:
name: traceway-otlp
key: headers
- name: OTEL_SERVICE_NAME
value: checkout-apiSimplest, and it keeps applications independent of the collectors. The cost is the token existing in every reporting namespace.
Traceway's ingest URL is the same OTLP/HTTP endpoint documented in the OpenTelemetry guide; nothing about it is Kubernetes-specific.
Dashboards
Open the command palette with ⌘K and install the OTelemetry Server Agent template. It is already wired to the hostmetrics names the node agent reports, so it works unchanged for nodes.
For pod-level views, build widgets on the kubelet metrics and group by a Kubernetes tag: k8s.pod.cpu.utilization grouped by k8s.pod.name, k8s.pod.memory.usage grouped by k8s.namespace.name, and so on. Grouping by tag is described in Dashboards.
Dashboards belong to the organization, so one Kubernetes dashboard applies to every project that reports a cluster.
Cardinality
Kubernetes generates a lot of distinct values, and each combination of tag values is a stored series.
metric_groups: [node, pod]is the default in the manifests. Addingcontainermultiplies pod series by the number of containers per pod.- Pod names change on every rollout. A deployment that ships ten times a day leaves ten times as many
k8s.pod.namevalues behind in a week. Group dashboards byk8s.deployment.namefor anything you want stable over time, and reach fork8s.pod.namewhen debugging a specific pod. - Wide time ranges read pre-aggregated rollups rather than raw points, so cardinality costs storage more than it costs query speed. See Metrics.
Logs
The node agent tails /var/log/pods/*/*/*.log and uses the collector's container operator, so containerd, CRI-O and Docker formats all parse, and k8s.pod.name, k8s.namespace.name and k8s.container.name come off the file path.
Pod logs have no service.name of their own, and the Logs page filters by service, so the config falls back to the container name:
transform/log_service_name:
  error_mode: ignore
  log_statements:
    - context: resource
      statements:
        - set(attributes["service.name"], attributes["k8s.container.name"]) where attributes["service.name"] == nil
Two things worth knowing:
- The agent starts at the end of each file, so it does not replay history on first install. A checkpoint file under
/var/lib/traceway-collectoron each node keeps its position across restarts. - The
tracewaynamespace is excluded from log collection. Without it the collector's own output becomes logs, which become collector output.
Application logs that already carry a trace id join up with their trace on the Logs page. Container stdout does not, unless the application writes the trace id into the line. Exporting logs through OpenTelemetry from inside the app is what gives you that linkage; see OTel Logs.
Alerting on the cluster
Cluster telemetry feeds the same alerting and on-call machinery as everything else. Useful rules:
- A metric rule on
k8s.container.restarts, to page on a crash-looping deployment before anyone notices the 500s. - A metric rule on
system.memory.utilizationper node, ahead of the eviction threshold. - A Monitor probing an Ingress hostname, so you find out when the cluster is reachable but the application is not.
Troubleshooting
No instances in the overview. The rows come from system.cpu.utilization. Check it is enabled:
kubectl -n traceway exec ds/traceway-node-agent -- \
  sh -c 'grep -A3 "cpu:" /conf/config.yaml'
One instance instead of one per node. service.name is not per node. Confirm K8S_NODE_NAME reaches the container:
kubectl -n traceway exec ds/traceway-node-agent -- printenv K8S_NODE_NAMEInstances are not grouped by cluster. The Group by Kubernetes cluster option only appears once at least one instance carries k8s.cluster.name. Check TRACEWAY_CLUSTER_NAME is set in the traceway-settings ConfigMap and the pods were restarted after it changed.
CPU shows but memory and disk are blank. system.memory.utilization and system.filesystem.utilization are separately opt-in and are easy to miss when adapting an existing collector config.
401 from the exporter. The collector logs the status code. The token must be the project token from the project's Settings page, not a personal access token or an upload token.
No pod logs. Confirm /var/log/pods is mounted and readable. On a node with a read-only root filesystem the checkpoint hostPath may also fail to create; the collector logs that at startup.
Exporter looks healthy but nothing appears. Check the project, not the collector. Open Dashboards, add a widget, and search the metric dropdown for system.cpu.utilization: if the name is not there, the points are landing in a different project than the one you are looking at.
Running Traceway itself on Kubernetes
Separate from monitoring a cluster, Traceway can run in one. The repository ships a Helm chart at helm/traceway (opens in a new tab) with three variants: minimal against external ClickHouse and PostgreSQL (the production shape), sqlite for the embedded single-container deployment, and full for the all-in-one image. See Self Host for the trade-offs between them.
Next steps
- Organization Overview for what the Servers page does with all this
- OpenTelemetry for instrumenting the applications
- Resource Attributes for the full allowlist
- Dashboards for building pod and namespace views