Logs
Logs are time-stamped records emitted by your application as it runs. Traceway ingests OpenTelemetry logs via OTLP/HTTP, indexes them by body, severity, service, trace, and attributes, and links each log back to the trace and span that produced it.
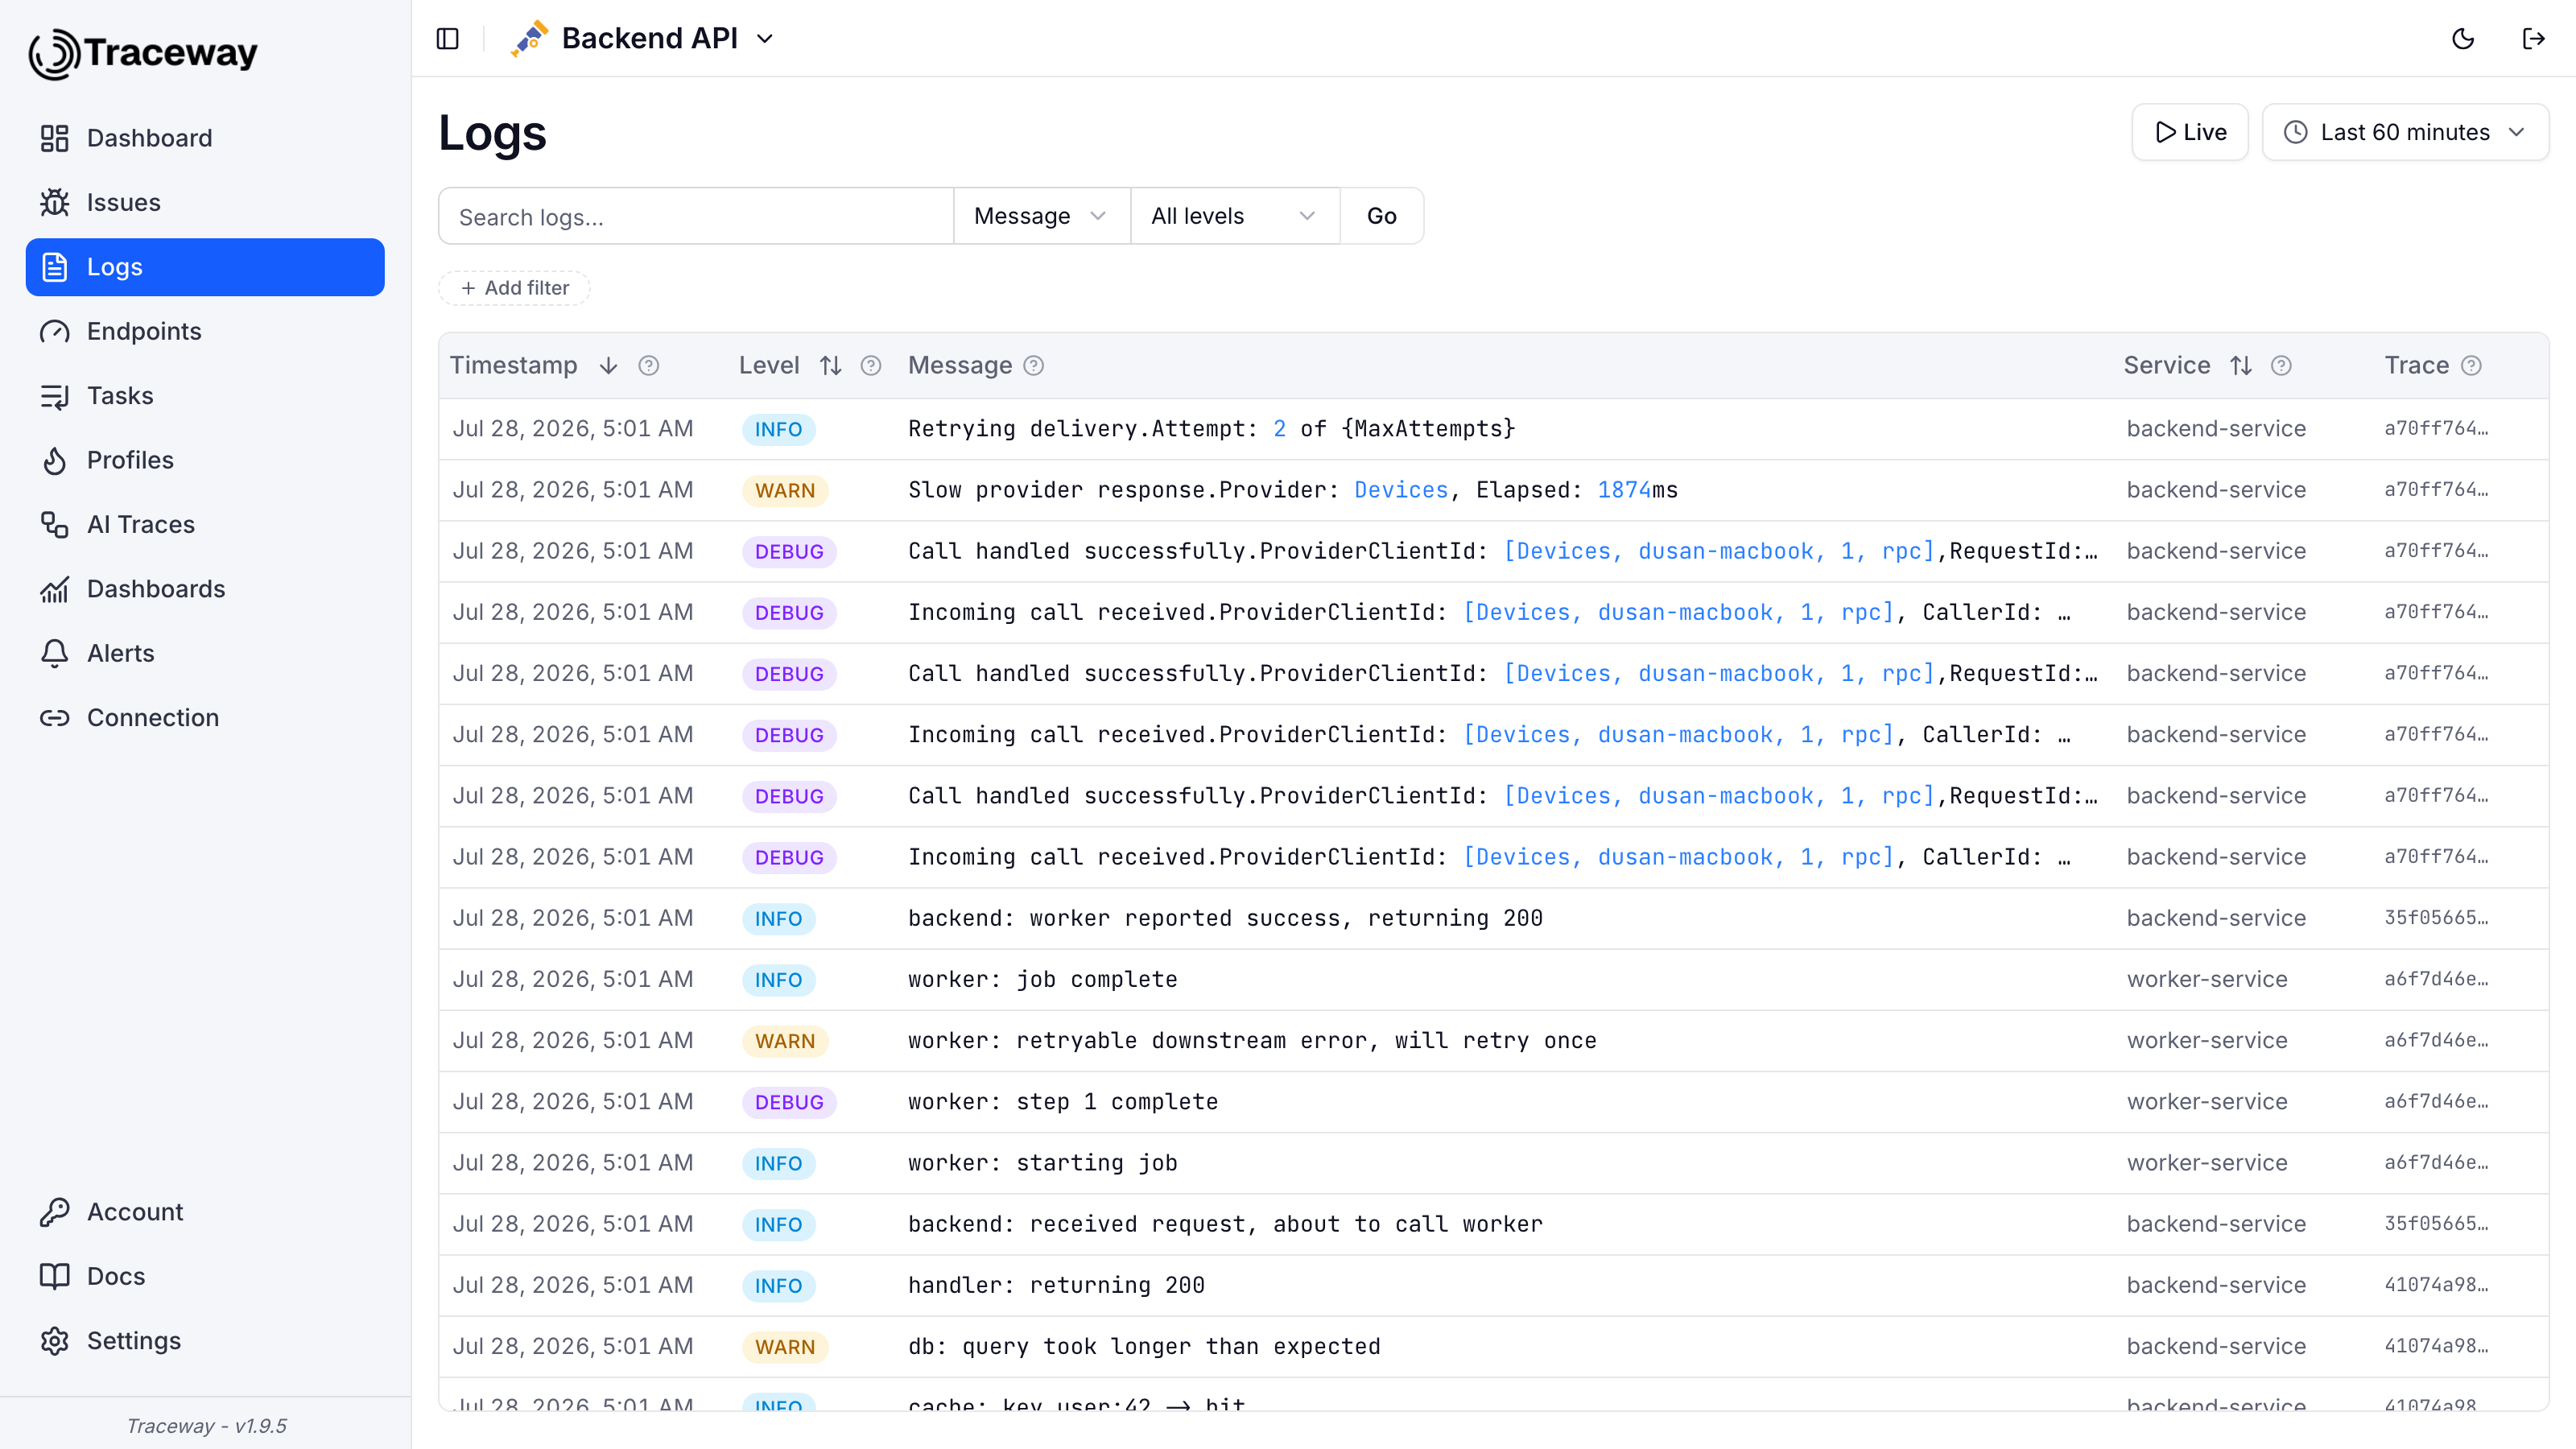
Log Record Structure
Each log record contains the following fields:
| Field | Description |
|---|---|
| Timestamp | When the log was emitted |
| Severity Number | OTLP severity number (1-24) that maps to a text level |
| Severity Text | TRACE, DEBUG, INFO, WARN, ERROR, or FATAL |
| Service Name | From the resource attribute service.name |
| Body | The log message |
| Trace ID | Hex-encoded OTel trace ID of the active span (if any) |
| Span ID | Hex-encoded OTel span ID of the active span (if any) |
| Resource Attributes | Key-value pairs from the resource (e.g. service.version, deployment.environment) |
| Scope Attributes | Key-value pairs from the instrumentation scope |
| Log Attributes | Key-value pairs attached to the log record itself |
Severity Levels
Traceway supports six severity levels, matching the OpenTelemetry specification:
| Severity | OTLP Number Range | Use Case |
|---|---|---|
| TRACE | 1-4 | Very detailed diagnostic output |
| DEBUG | 5-8 | Developer-level debug information |
| INFO | 9-12 | Routine operational messages |
| WARN | 13-16 | Unexpected but recoverable conditions |
| ERROR | 17-20 | Errors that don't stop the service |
| FATAL | 21+ | Errors that cause termination or severe impact |
If your SDK sends only a severity number (no text), Traceway assigns the text level based on the number's range. If it sends only a text level, the number is computed from the text.
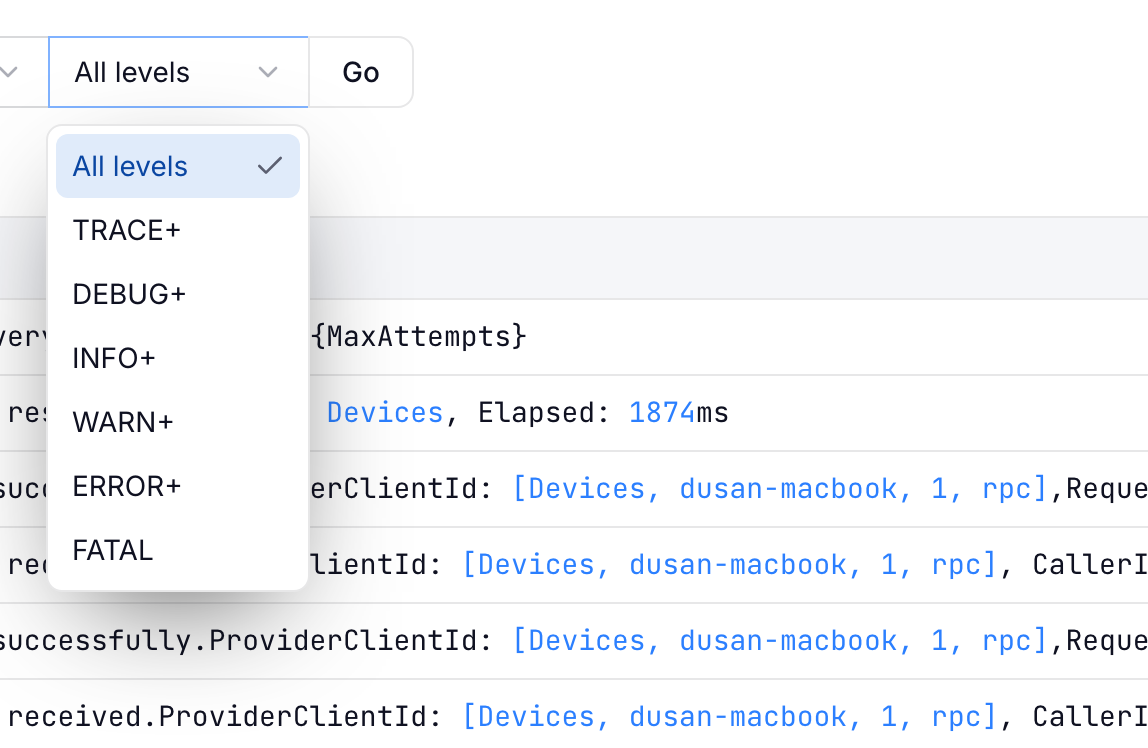
The severity dropdown on the Logs page filters by threshold. Picking WARN+ keeps warnings and everything more severe.
Attributes: Resource, Scope, Log
OTel logs carry three layers of attributes, all of which are indexed and searchable in Traceway:
- Resource attributes describe the emitting process, e.g.
service.name,service.version,host.name,deployment.environment. Every log emitted by a given service carries the same resource attributes. - Scope attributes describe the instrumentation library or logger emitting the record, e.g.
logger.name, scopeversion. Useful for separating framework logs from application logs. - Log attributes are specific to a single log record, e.g.
user.id,order.id,request.method. These are the per-event details you add when logging.
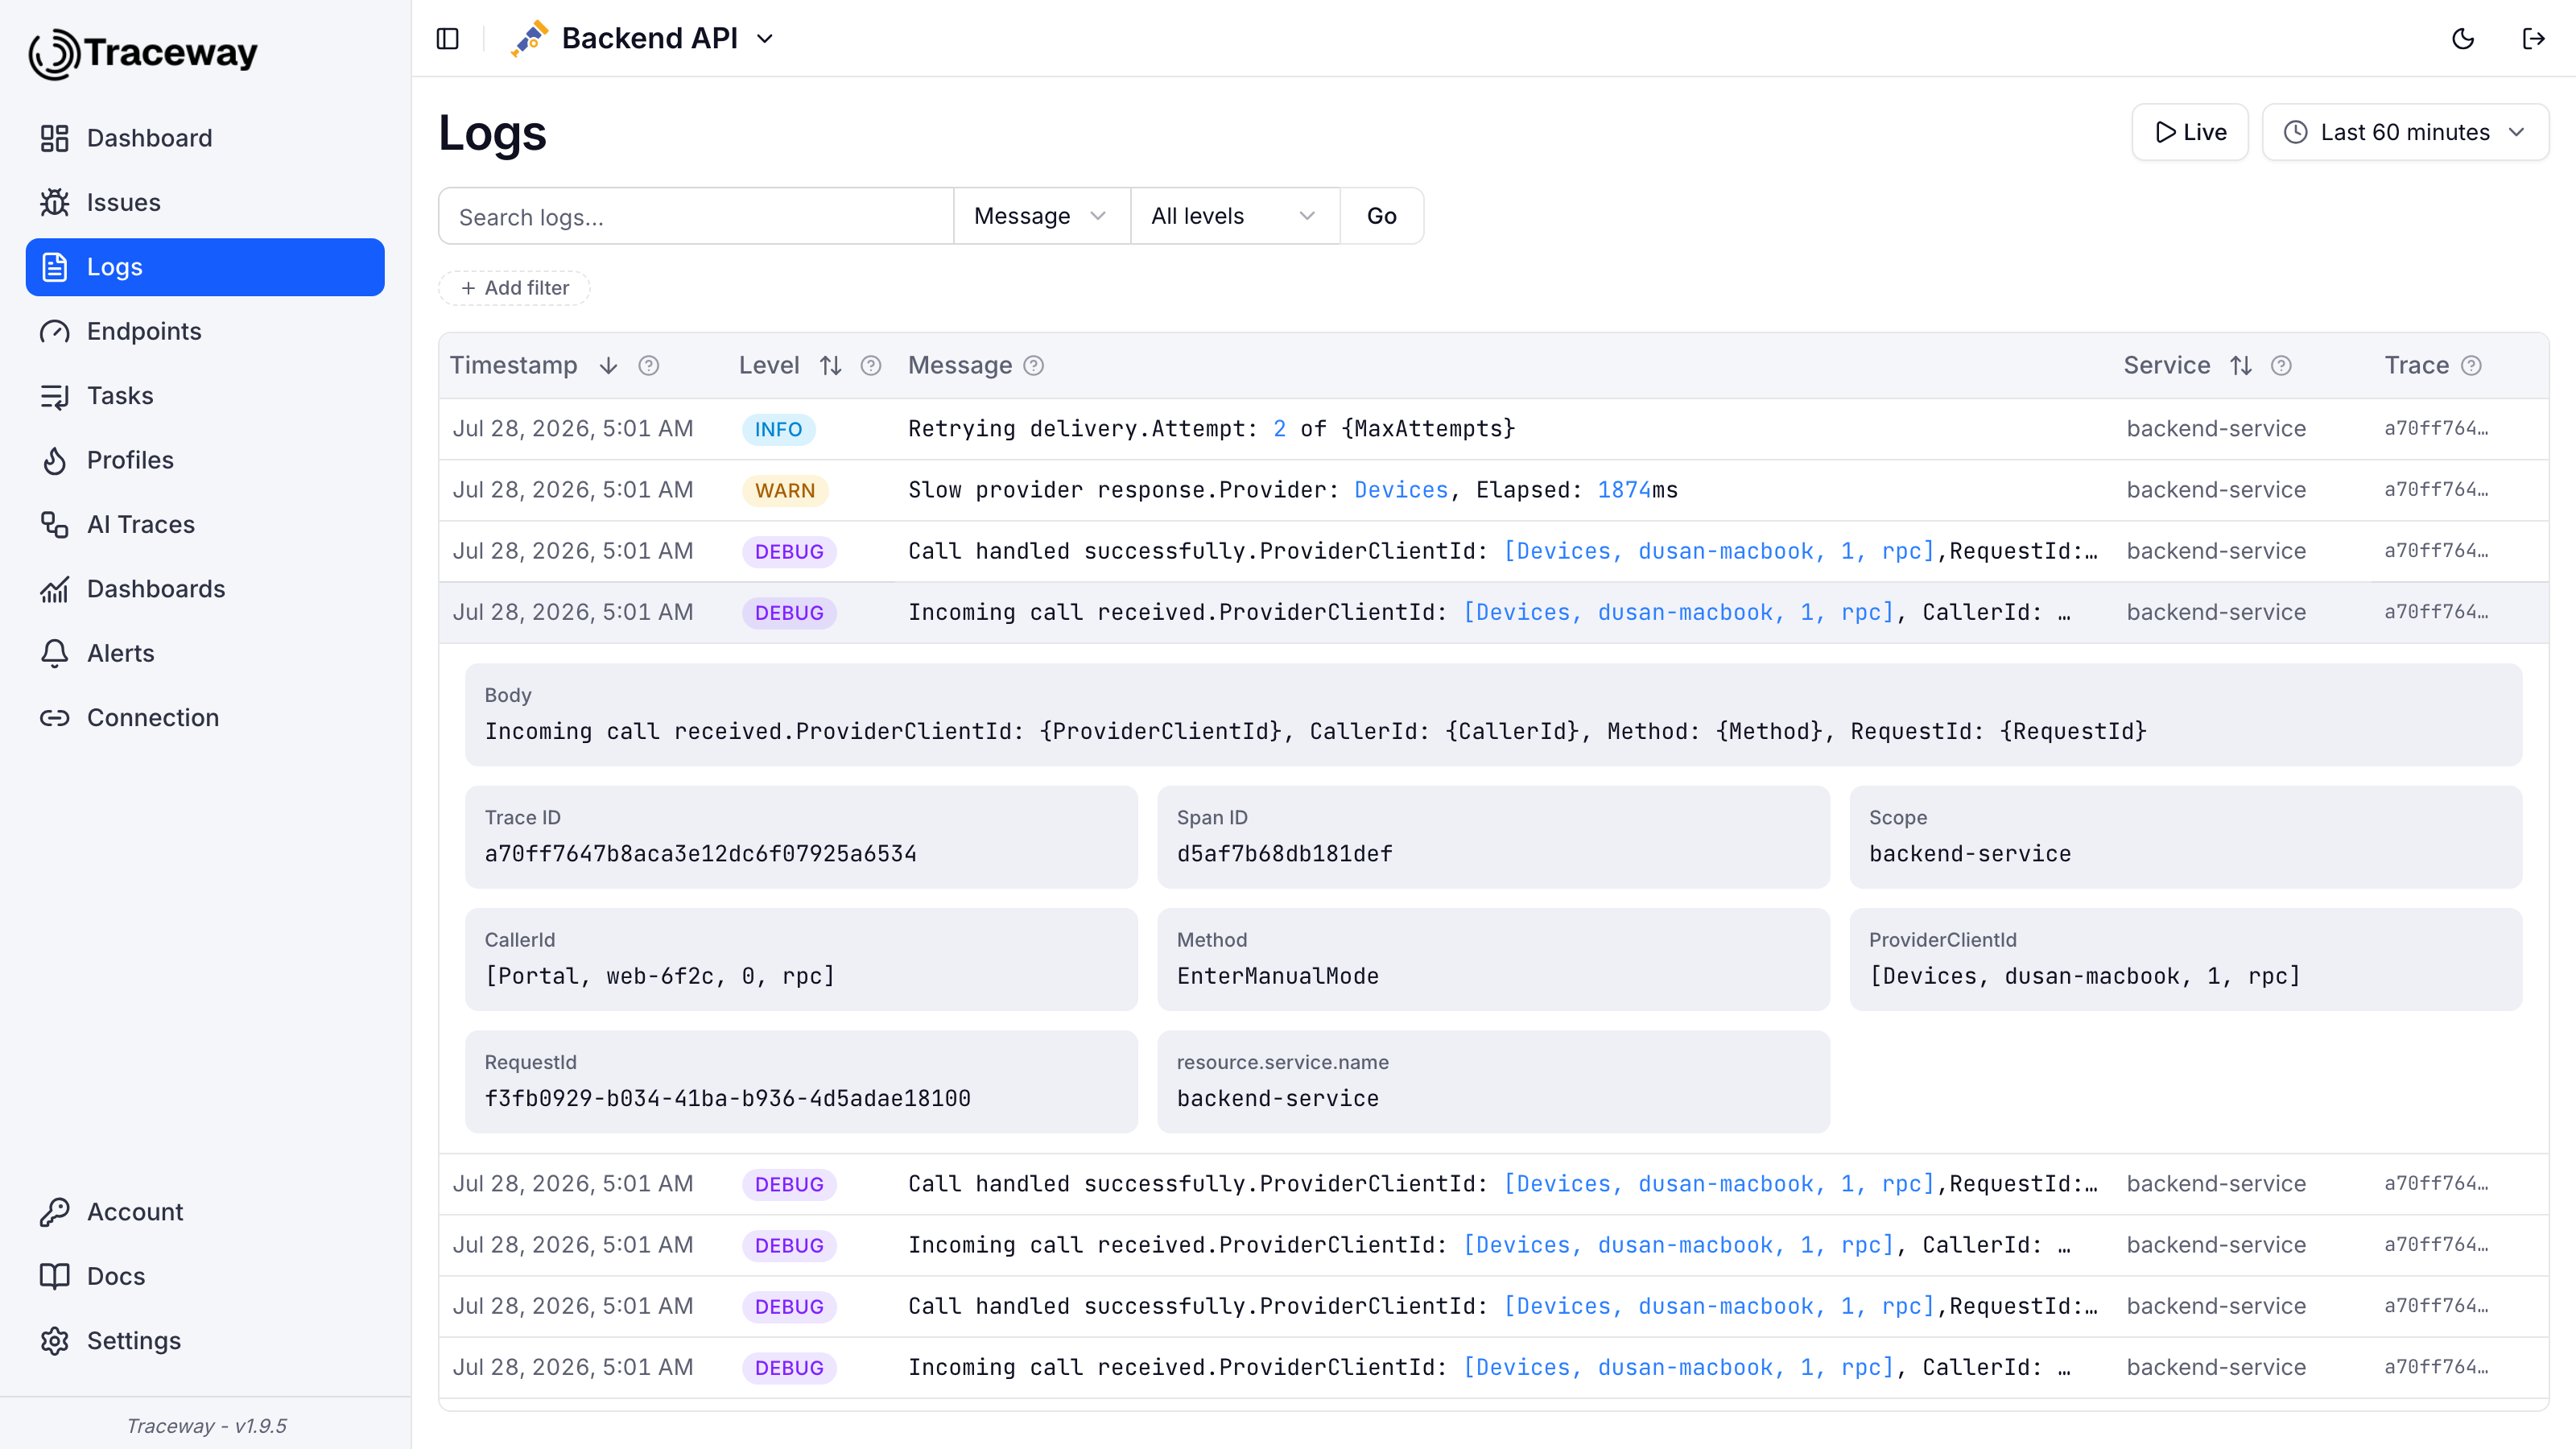
Click any log row to expand it. The expanded view shows the raw body, the linked trace and span IDs, and every attribute from all three layers. Each attribute has a filter toggle, so you can pivot from a single log line to all logs sharing that value in one click.
See Attributes for the general model used across traces, spans, and logs.
Message Templates
Many logging libraries send structured message templates instead of pre-rendered strings. The body keeps placeholders like {Provider}, and the values arrive as log attributes. This is the default in Serilog and Microsoft.Extensions.Logging, and other ecosystems use the same convention.
Traceway renders these templates inline. Each placeholder is resolved against the log's attributes and the value is highlighted in the message. Hover a highlighted value to see the parameter name it came from.

A few details:
- Alignment and format specs are understood, so
{ElapsedMs:N0}resolves to its attribute value. - The
@and$operator prefixes from Serilog-style templates are supported. - A placeholder with no matching attribute stays as literal text, like
{MaxAttempts}in the row above. Nothing is silently dropped.
Searching Logs
The Logs page supports filtering and search across all three attribute layers plus the body:
- Severity threshold: keep only records at or above a minimum level (e.g.
WARN+hides INFO and below). - Service: exact match on
service.name. - Trace: exact match on the hex trace ID.
- Body search: full-text search over the log message. Single-token queries use a token-bloom index for speed; multi-word or punctuation-heavy queries fall back to substring matching.
- Attribute filters: match on any
resource.*,scope.*, or log attribute key, either as equals or not equals. - Time range: pick from presets (24h, 7d, 30d) or a custom window.
All filters combine. Results load newest first, and a "Load more" button at the end of the list fetches older records in the same query.
Attribute Filters
Click Add filter to open the filter dialog. Enter a key with its layer prefix, pick the operator, and set the value. The Not equals operator excludes matching logs, which is useful for muting a noisy logger or a known-chatty endpoint.
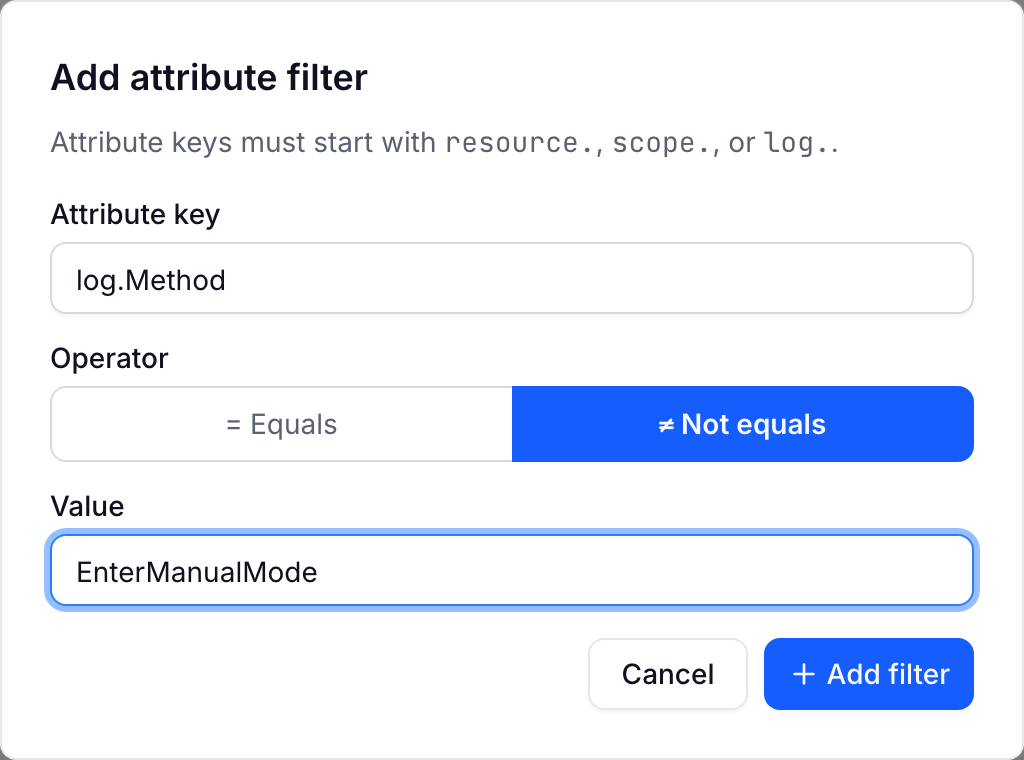
Active filters show as pills under the search bar. Exclusion pills render the operator in red. Click a pill to edit it, or its X to remove it.

Live Tail
The Live button next to the time range picker turns the Logs page into a live tail. While it is on, Traceway polls for new records every few seconds and prepends them to the list, so you can watch logs arrive as you exercise your system.
A few details worth knowing:
- Live tail works with preset ranges only. A custom range is a fixed window in the past, so there is nothing to tail.
- The list is pinned to newest first. Changing the sort stops the tail.
- All active filters apply to the tail, so you can live-follow a single service or severity.
- If you scroll down to read, the view holds its position while new rows arrive above. Scroll back to the top to follow the newest logs again.
- Under very high log volume the tail jumps ahead to the newest records instead of trying to backfill every line in between.
Linking to Traces
When your SDK emits a log inside an active OTel span context, the log record automatically carries that span's trace_id and span_id. This means:
- Every endpoint and task detail page has a Logs panel showing the log lines for that trace.
- Logs from services reporting to the selected project are shown together when they share the trace ID. The trace log panel does not cross project boundaries.
- Jumping from a log to the trace that produced it is a single click in the dashboard.
No extra configuration is required. The standard OTel context propagation carries the IDs to your logger.
Retention
Logs are stored in ClickHouse with daily partitioning and a 90-day TTL on the timestamp date. Older logs are removed automatically without operator intervention. Self-hosted deployments on SQLite or DuckDB prune logs after 30 days by default, configurable with SQLITE_RETENTION_DAYS (on DuckDB, DUCKDB_RETENTION_DAYS). They can additionally cap the log table with LOG_RECORDS_MAX_ROWS. The cap is a cleanup task, not a hard limit: every minute the oldest logs are deleted until only the newest N rows remain. A burst that ingests more than N rows within one minute can still push the table past the cap until the next run, so size the cap with headroom for your peak log volume.
Sending Logs
See the SDK-specific guides for setup instructions:
- OpenTelemetry: direct SDK export or OTel Collector
- Symfony: Monolog handler and the OTel PHP Logs API
- Cloudflare Workers: Worker-side OTel logs exporter
For API callers, POST /api/logs accepts traceId and optional spanId, scoped to the selected project and time window. The retired distributedTraceId and excludeTraceId selectors return 400, so stale clients cannot silently widen a query. Invalid trace IDs also return 400.