Remote SDK Config (Beta)
beta tag: npm install @tracewayapp/frontend@beta (or react@beta, vue@beta, svelte@beta, jquery@beta). A plain npm install still installs the stable 1.x SDK, which does not poll for remote settings. Options, defaults and the settings document can change before 2.0 is stable.The browser SDK decides, on every device, what to send right away, what to keep on the device in case it is needed, and what to drop. Traceway tells it how, for each group of clients, while the app runs. From the dashboard you change what one release, one browser, one user or a tenth of your traffic sends, without shipping a build. Telemetry can wait on the device and leave only when something goes wrong, or when someone asks for it.
Remote config needs the OpenTelemetry-based browser SDK, @tracewayapp/frontend 2.x (beta, and the React, Vue, Svelte and jQuery wrappers of the same version), and a Traceway server with the Data Collection tab. The tab appears in the settings of React, Vue, Svelte and jQuery projects. Setup steps are on Set up remote config; every field is in the settings reference.
Remote configuration is available only for browser frontend projects (React, Svelte, Vue and jQuery). Backend and mobile projects have no remote-collection controls, and their OpAMP/config requests are rejected. For a full-stack app, use its separate browser project.
Production defaults keep session lifecycle metadata and web vitals on, with healthy breadcrumbs and replay buffered locally. An accepted exception uploads up to 10 minutes of buffered breadcrumbs and a 30-second replay clip; no full-session replay is uploaded by default. Error clips have a 5-second cooldown and a limit of 20 per session.
Errors are not sampled by default. Duplicate exceptions (same type, message and stack) within 1 second are suppressed, and each running client accepts at most 60 errors in a rolling minute. The next accepted error carries the aggregate traceway.error.suppressed_count. Configure errorLimits: { maxPerMinute: 60, duplicateWindowMs: 1000 } to tune these limits; they reset when the SDK is recreated.
For an optional stable sample of healthy-session breadcrumbs and request spans, use baselineSampleRate: 0.01 (1%). The default is 0. Selection uses the session ID and persists across page reloads within that session. It does not enable replay or override explicitly disabled signals, signal filters, or exporter limits. Web vitals remain enabled independently, so performance diagnosis is not restricted to sessions with errors.
What you can do with it
- Change what a cohort sends. A rule targets clients by what they report: release (
service.version), environment, browser, OS,user.id, any attribute your app sets, plus a percentage rollout. It switches each signal between stream, buffer and off, and sets sample rates. - Upload what led up to a problem. Triggers run on the device and watch every record: "three failed requests within a minute", "
payment failedwas logged", "the app calledtrack('checkout_failed')". When one fires, the device uploads what it was holding, with a replay clip. - Capture one user or one device. Click Capture on a session or an issue. The next time that browser checks in, it uploads its recent history and streams everything for up to 24 hours.
- Turn a broken client off. A rule with the kill switch stops a release or a browser version from sending anything.
The pieces
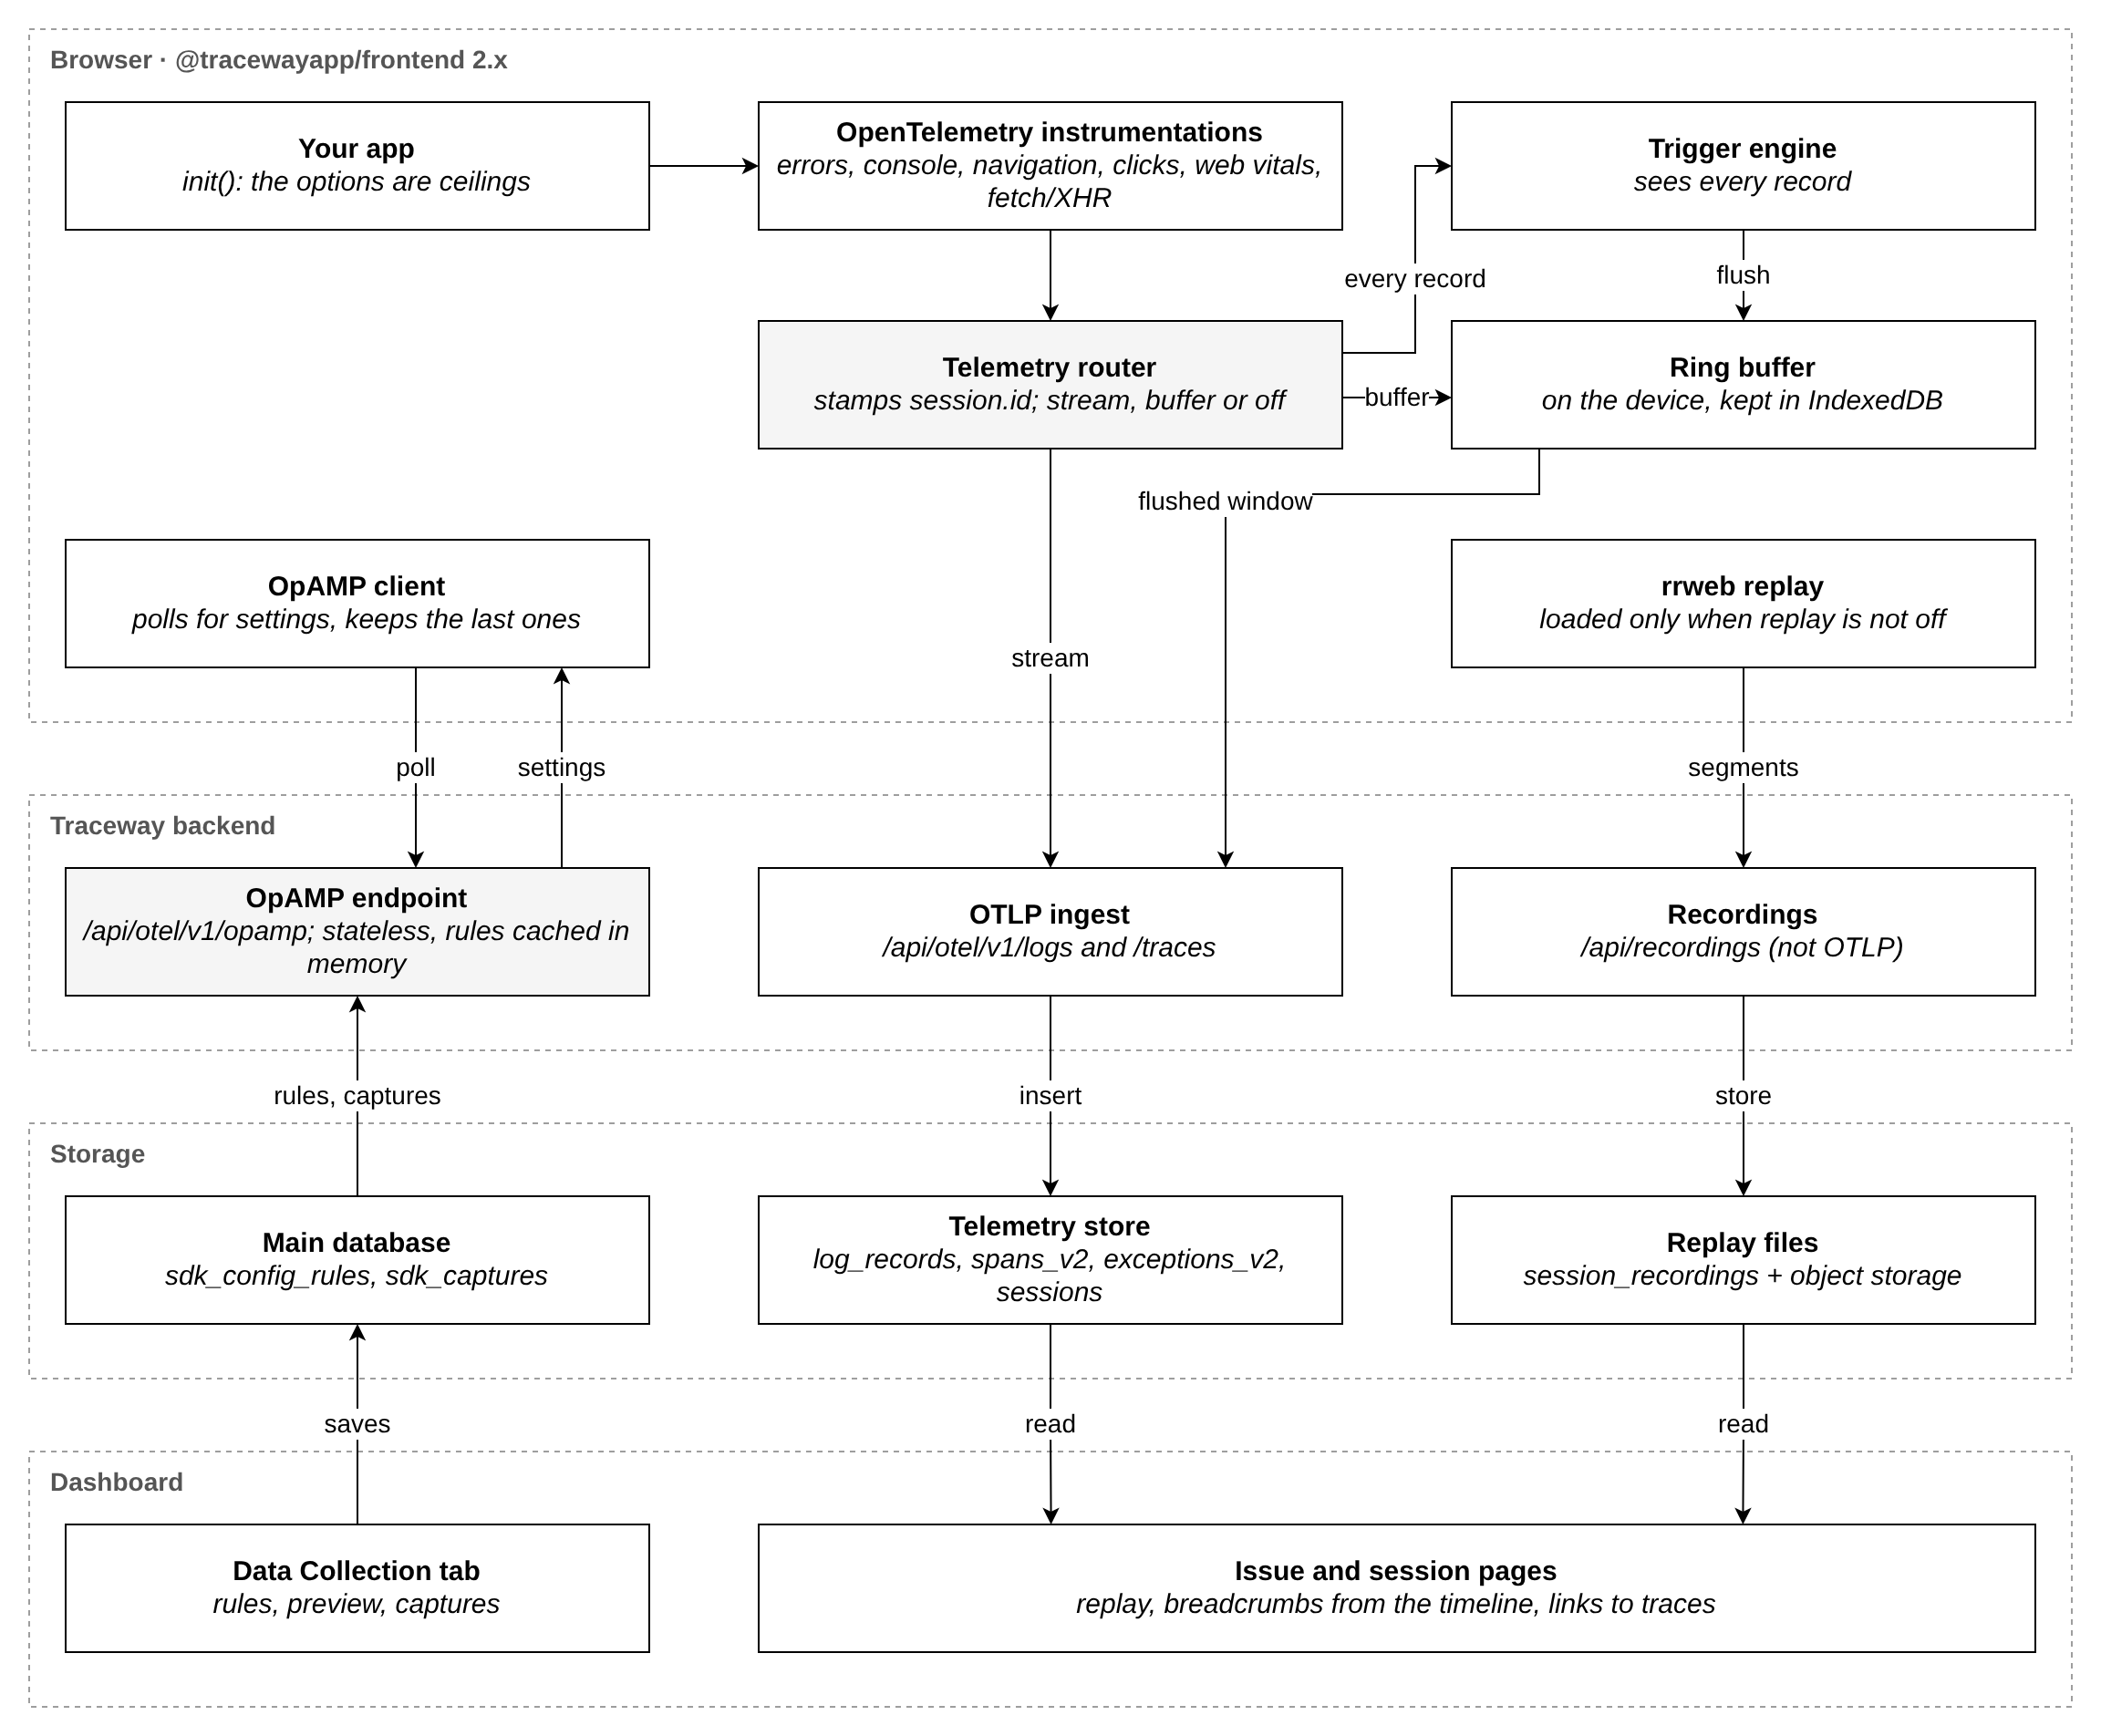
The browser talks to Traceway over three channels, all authenticated with the project token from the connection string:
| Channel | Endpoint | Format | Carries |
|---|---|---|---|
| Telemetry | POST /api/otel/v1/logs, POST /api/otel/v1/traces | OTLP/HTTP | Exceptions, messages, console lines, navigation, clicks, web vitals, timings, app events and session start/end as log records; fetch and XHR as CLIENT spans |
| Replay | POST /api/recordings | gzipped JSON | rrweb segments, nothing else |
| Control | POST /api/otel/v1/opamp | OpAMP over plain HTTP | The client's attributes up, its settings document and poll interval down |
Inside the SDK:
- OpenTelemetry instrumentations from the OpenTelemetry Browser SIG produce the records: uncaught errors,
console.*, route changes, clicks, web vitals, resource and navigation timing,fetchand XHR. Requests carry the W3Ctraceparentheader, so a browser request and the backend work it caused share one trace. - The telemetry router stamps every record with
session.id, looks up the signal's current mode, and sends the record to the exporter (stream), into the ring buffer (buffer), or nowhere (off). - The ring buffer holds the last 10 minutes or 2 MB of buffered records on the device. It is written to IndexedDB, so the next page of the same session can still upload what the previous page saw.
- The trigger engine sees every record, whatever its mode, and runs the triggers of the settings document.
- rrweb records session replay. It is only loaded when replay is not off.
- The OpAMP client polls Traceway for the settings document and remembers the last one in
localStorage, so the next page starts with it.
The OpAMP endpoint evaluates rules from each poll's complete client description, so any backend instance can answer any browser. Rules, captures, and their first delivery/application/data-receipt timestamps live in the shared main database. Compiled rules are cached per project; polls and data matching an active capture also record its progress, in the background and once per stage. A cache miss or the two-minute cache expiry reloads the configuration.
Three modes
Every signal is in exactly one mode at any moment:
- stream: handed to the OTLP exporter and sent within about a second.
- buffer: kept on the device. It leaves only when a trigger flushes a time window, or a capture starts.
- off: dropped. Triggers still see the record, so you can trigger on something you never upload.
| Signal | What it covers |
|---|---|
errors | Uncaught errors, unhandled rejections and captureException |
messages | captureMessage |
network | fetch and XHR spans |
console | console.* calls (with an optional minimum severity) |
navigation | Route changes |
userActions | Clicks |
webVitals | LCP, INP, CLS and the other web vitals |
resourceTiming | Page and asset load timings |
custom | track() and recordAction() events |
Replay has the same three modes, plus a per-session sample rate. Session start and end events additionally respect sessions.enabled. Except when the kill switch is on, bookkeeping events of the SDK itself (traceway.config.applied, traceway.trigger.fired, traceway.capture.started, session events) always stream, so you can see in Logs what the control plane did on each device.
How a signal's mode is decided
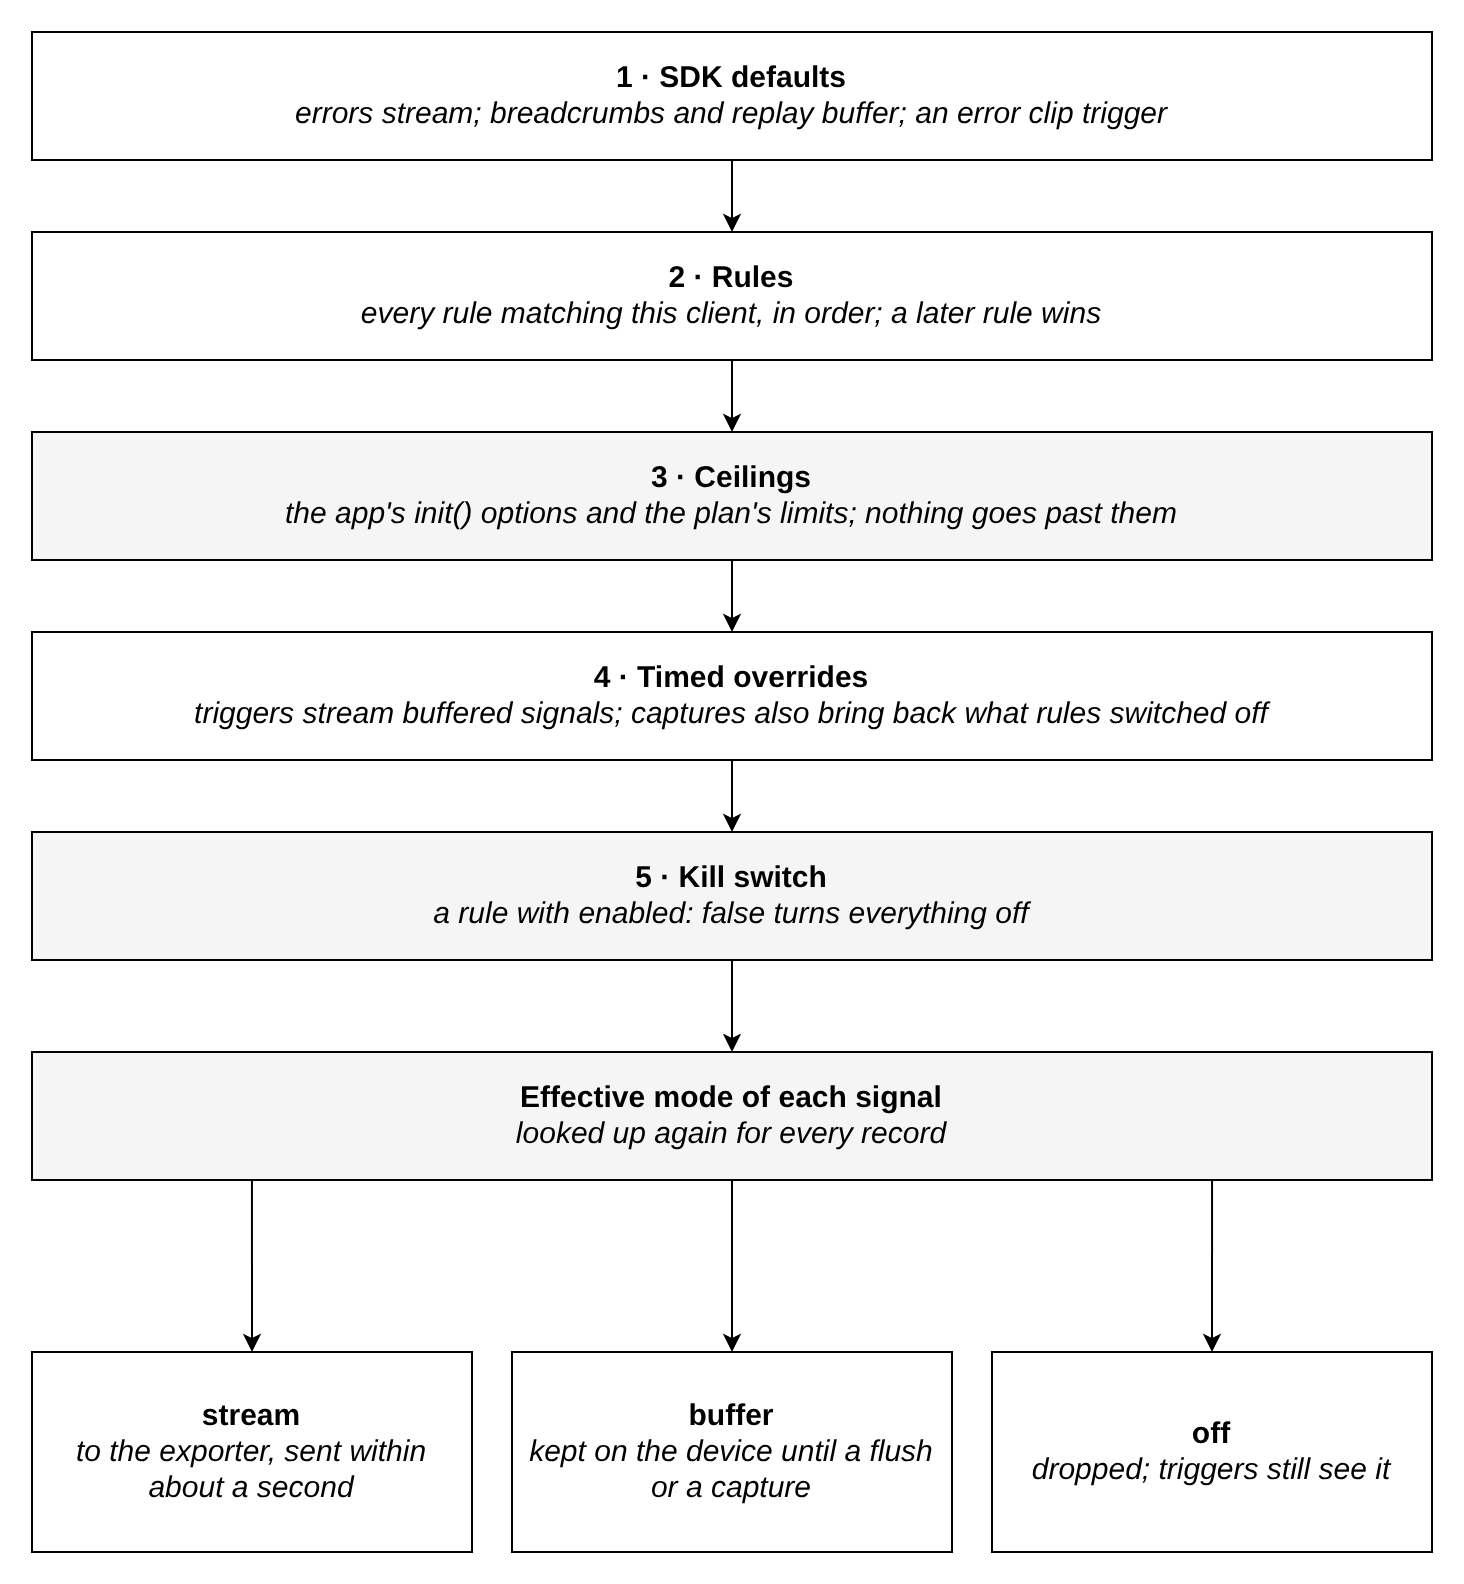
- SDK defaults. With no rules, errors and messages stream; console, network, navigation, clicks, custom events and replay are buffered; web vitals stream; resource timing is off. A built-in trigger,
default-exception, uploads up to 10 minutes of buffered breadcrumbs and a 30-second replay clip. Replay has a 5-second cooldown and a limit of 20 clips per session; breadcrumb flushing continues during those replay limits, within the diagnostic budget.recordAllSessions: trueininit()streams breadcrumbs and replay instead. - Rules. Every enabled rule whose conditions match the client contributes the fields it sets, in the order of the rules list; a later rule wins. A rule only lists what it changes, and the server sends the browser the merged result, never the defaults. A client that no rule matches gets an empty document and runs on the defaults.
- Ceilings. The
capture*,sessionRecordingandsessionsoptions ofinit()are the most the page allows. If the app setssessionRecording: false, nothing on the server can turn replay on. The organization's plan adds its own limits: what the plan does not include (replay, exceptions or other data) is switched off at the source, so browsers stop sending data that would be dropped on arrival. - Timed overrides. A trigger's
streamaction streams the signals that are buffered for a while. A capture goes further and also brings back signals that a rule switched off. Both stay within the ceilings and the plan's limits. - Kill switch. A rule whose settings contain
enabled: falseturns everything off for the clients it matches, captures included.
The mode is looked up again for every record, so a change takes effect on the next record after the settings arrive.
Triggers
A trigger is an ordered list of steps and a list of actions. Each step is a matcher over a record: its event name, signal, severity, body, span name and status, duration, and any attribute of the record, the resource or the app's global attributes. Every matching record moves the trigger to its next step; a step can require a count of matches within a sliding window ("5 error lines within 60 seconds"), and withinSeconds bounds the time to the next step. Completing the last step fires the actions:
| Action | What it does |
|---|---|
flush | Uploads the buffered records of the last N seconds, optionally with a replay clip |
stream | Streams the buffered signals for N seconds, on this page |
startReplay | Streams replay for N seconds |
emit | Records a marker event you can search or trigger on |
capture | Starts a capture on this device: uploads the lookback, then streams for a duration that survives page loads |
A trigger keeps its progress per session and can be limited with a sample rate, a cooldown and a maximum number of fires per session. The SDK checks text with contains, icontains (any case), starts_with and glob (* and ?). There is no regular expression operator on purpose: a pattern sent from the server would run in the browser's backtracking regex engine, where one bad pattern can freeze the page. glob runs in linear time and looks at most at the first 4 KB of a value.
Captures
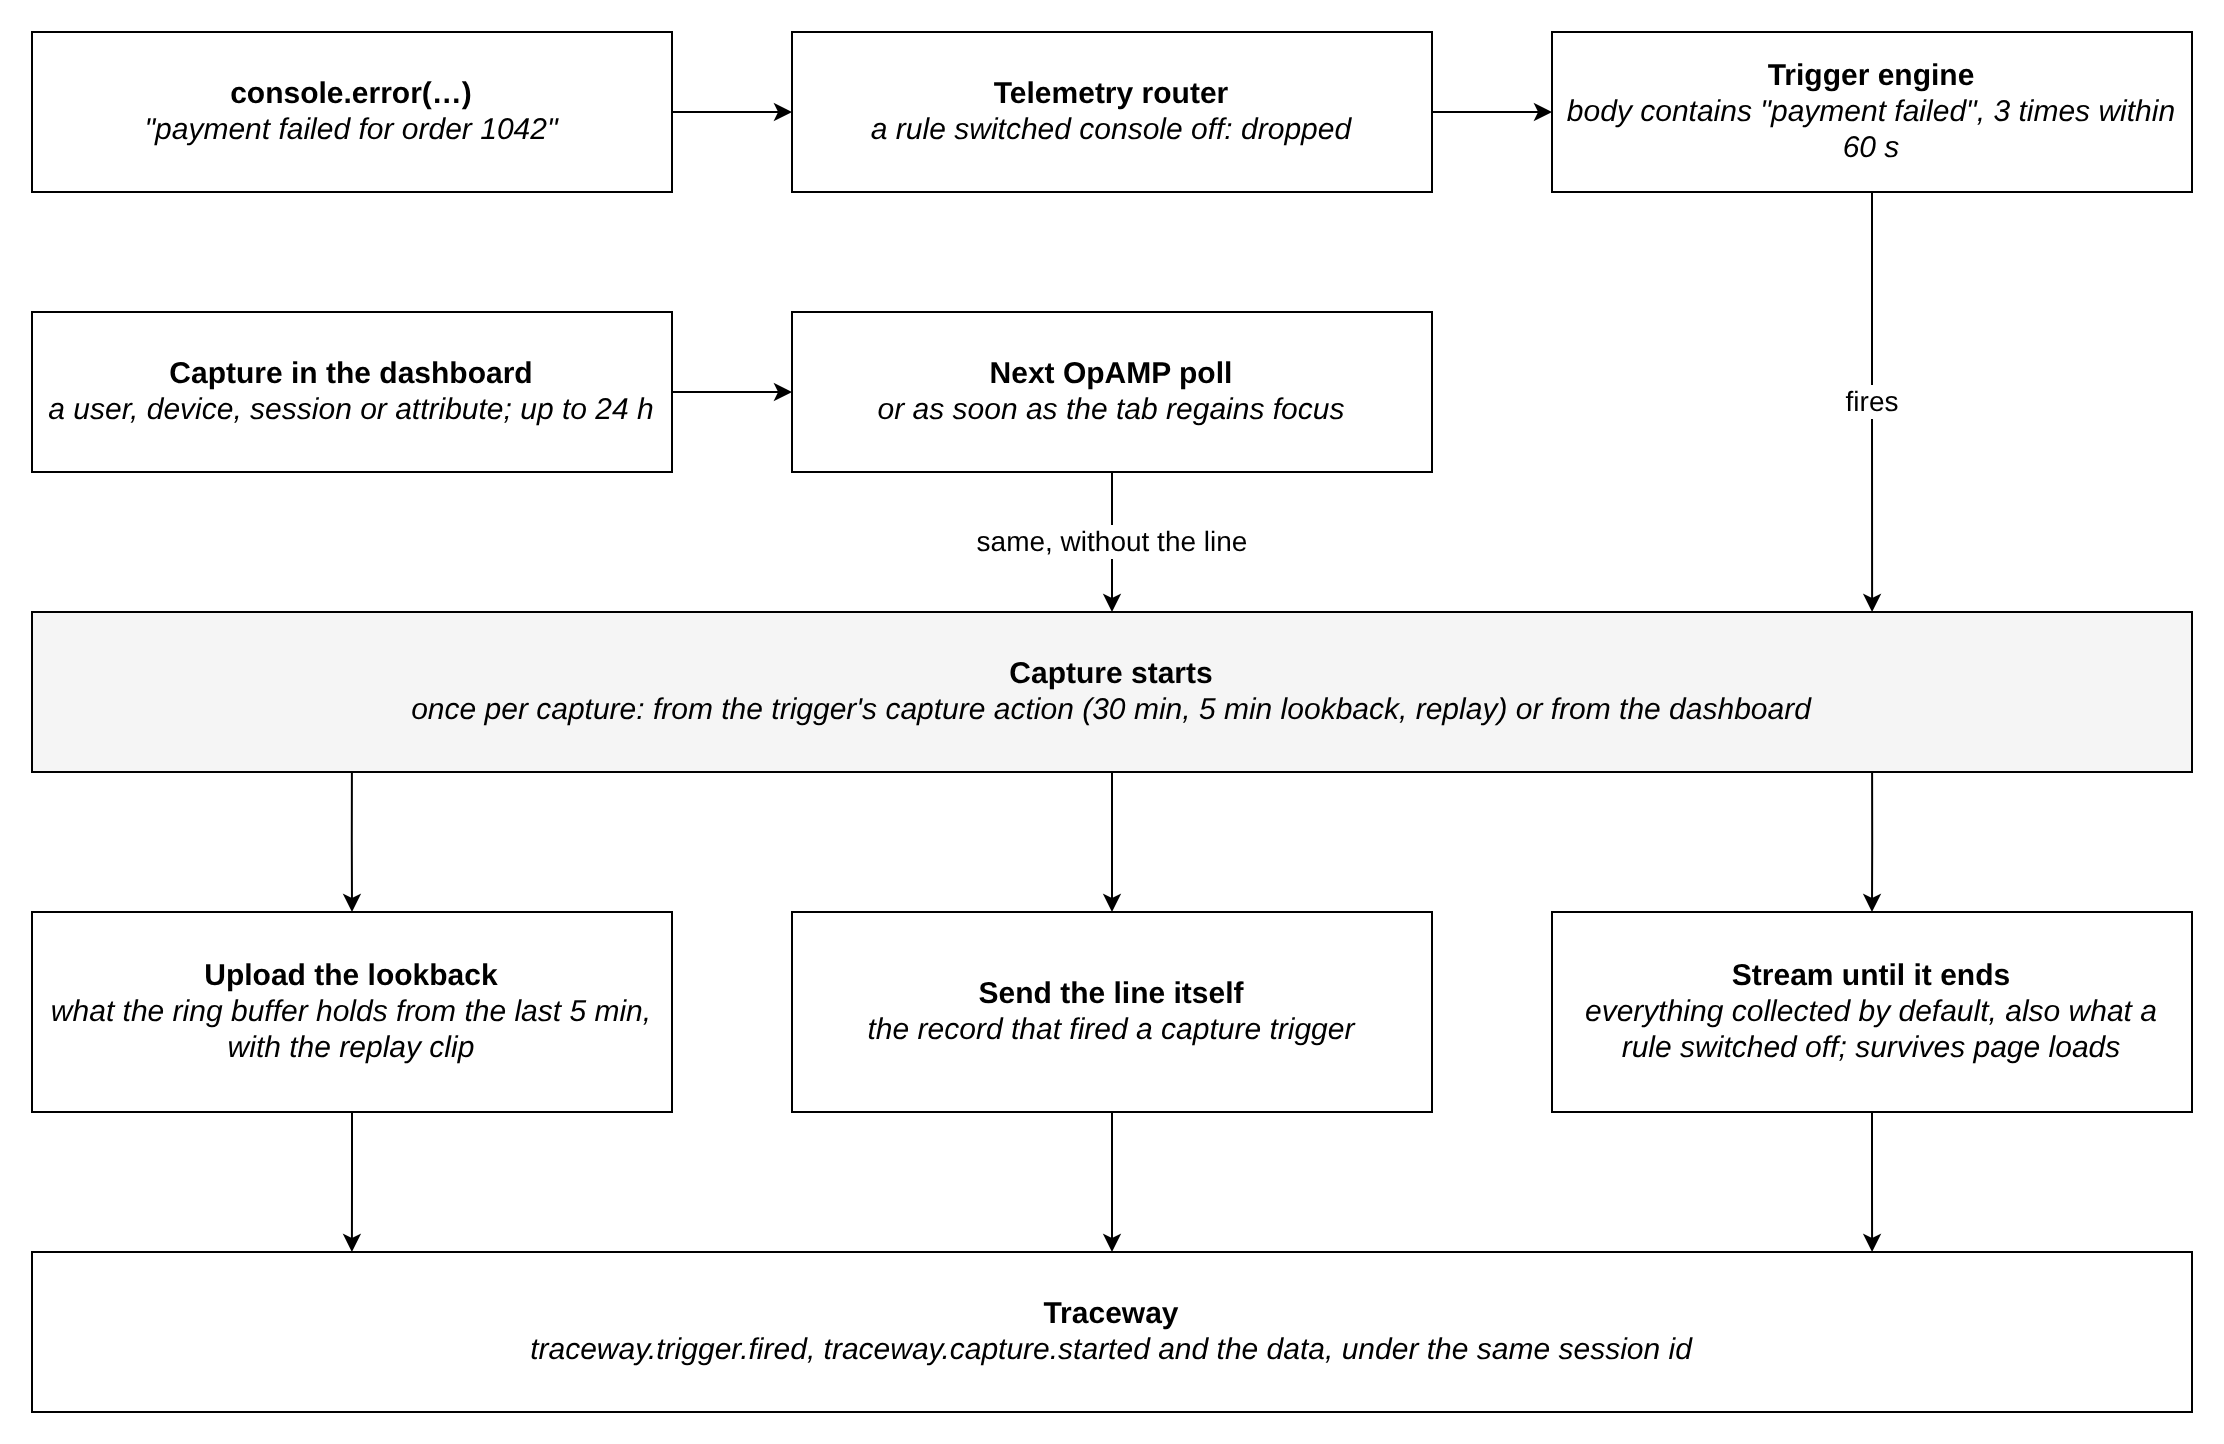
A capture makes one device upload what it was holding and stream everything for a while. It starts in one of two ways:
- From the dashboard: a capture targets a device (
service.instance.id, stable per browser profile), a user (user.id), a session, or any attribute, for 1 minute to 24 hours. It travels in the settings document of the clients it matches. A client under a capture polls every 60 seconds. - From a trigger with the
captureaction, for example when a log line repeats. The capture is stored inlocalStorage, so the pages that follow keep streaming until it ends; while it runs, the same trigger only extends it.
For dashboard captures, each tab uploads its lookback once per capture across pages. Trigger captures persist on the device until expiry. While a capture runs, its "*" means every signal the SDK collects by default, including those a rule switched off for this cohort. Resource timing, which is off by default, has to be named. When a trigger starts the capture, the record that fired it is uploaded too, so the log line that started a capture is part of it.
A dashboard capture reaches a browser on its next poll (5 minutes by default) or when a tab becomes visible after its polling interval has elapsed. There is no push channel: keeping a socket open per browser tab would cost more than it saves.
How settings reach the browser
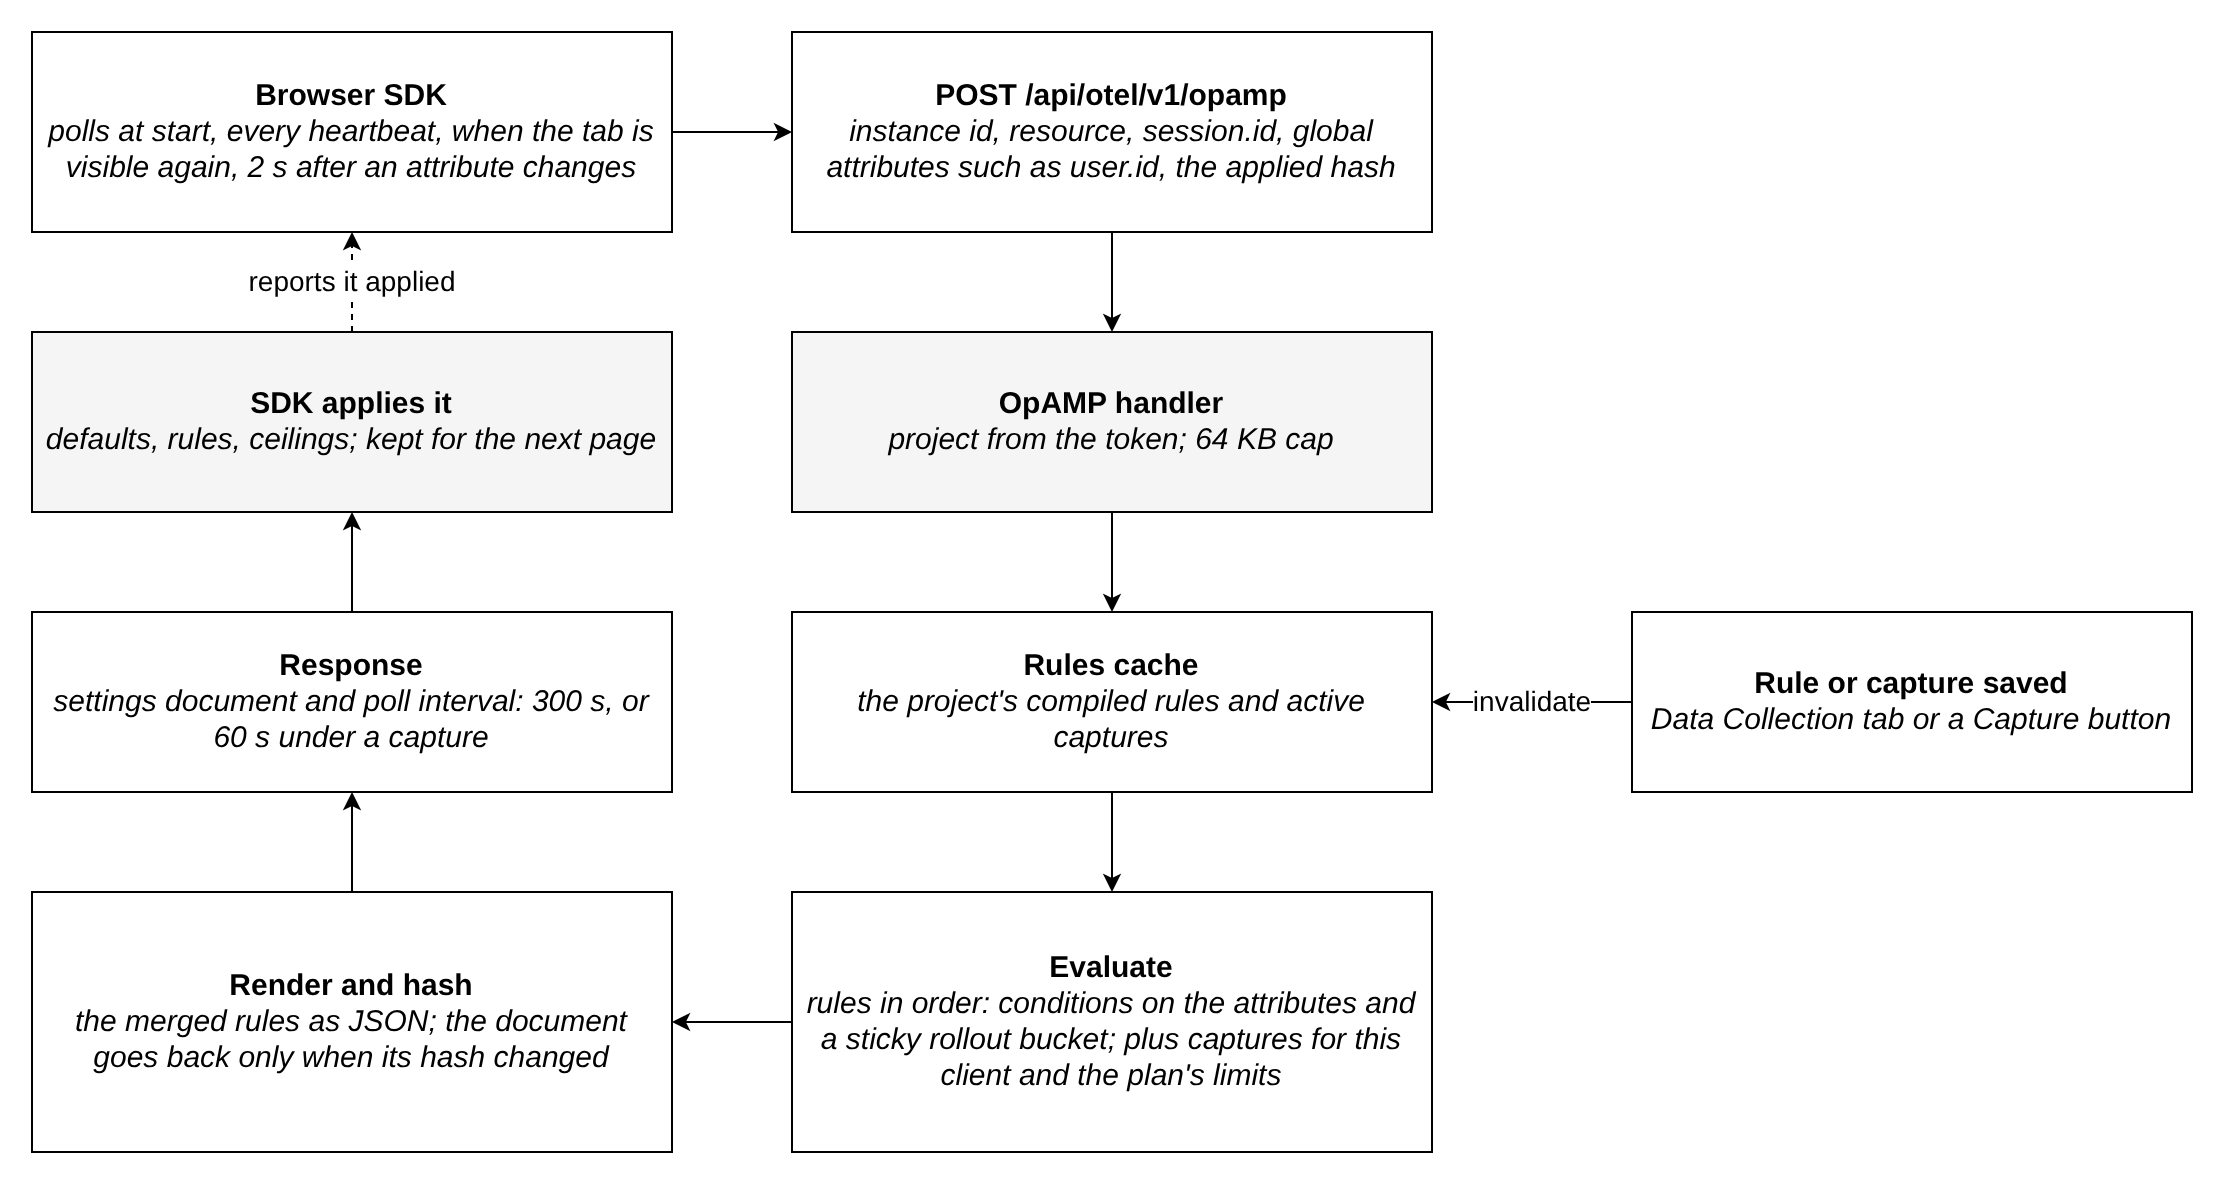
The SDK speaks OpAMP, OpenTelemetry's protocol for managing agents remotely, over plain HTTP:
- It polls at start, every heartbeat, when a tab becomes visible after its polling interval has elapsed, and two seconds after a global attribute or the session changes (
refreshConfig()polls at once). Each poll carries the browser's instance id, its resource attributes (app, release, environment, browser, OS),session.id, up to 64 global attributes such asuser.id, and the hash of the document it applied last. - The backend finds the project from the token and evaluates its rules against those attributes. A percentage rollout puts each browser in a fixed bucket per rule, so a client stays in or out as long as the percentage does not drop below it. It then adds the captures aimed at this client and the plan's limits.
- The document goes back only when its hash differs from what the browser applied, together with the poll interval: 5 minutes by default, 60 seconds while a capture targets the client.
- The SDK merges the document onto its defaults, clamps it to the ceilings and limits, stores it for the next page, and reports it as applied. A document it cannot read is reported as failed, and the SDK keeps the last good one.
Saving a rule or a capture invalidates the local cache after commit. PostgreSQL replicas receive an invalidation notification; the two-minute cache expiry bounds staleness if a notification is missed. A browser sees the change on its next poll.
Where breadcrumbs end up
Console lines, navigation, clicks and app events are stored as log records, and requests as spans, all tagged with session.id. Replay files hold only the recording. So a breadcrumb is stored once, and only if its mode sent it: buffered breadcrumbs reach Traceway with a trigger's flush or a capture, streamed ones always do.
The session page reads back the whole session; the issue page reads the 10 minutes before the exception. Each request row links to its trace, where the browser's request sits above the backend work it caused.
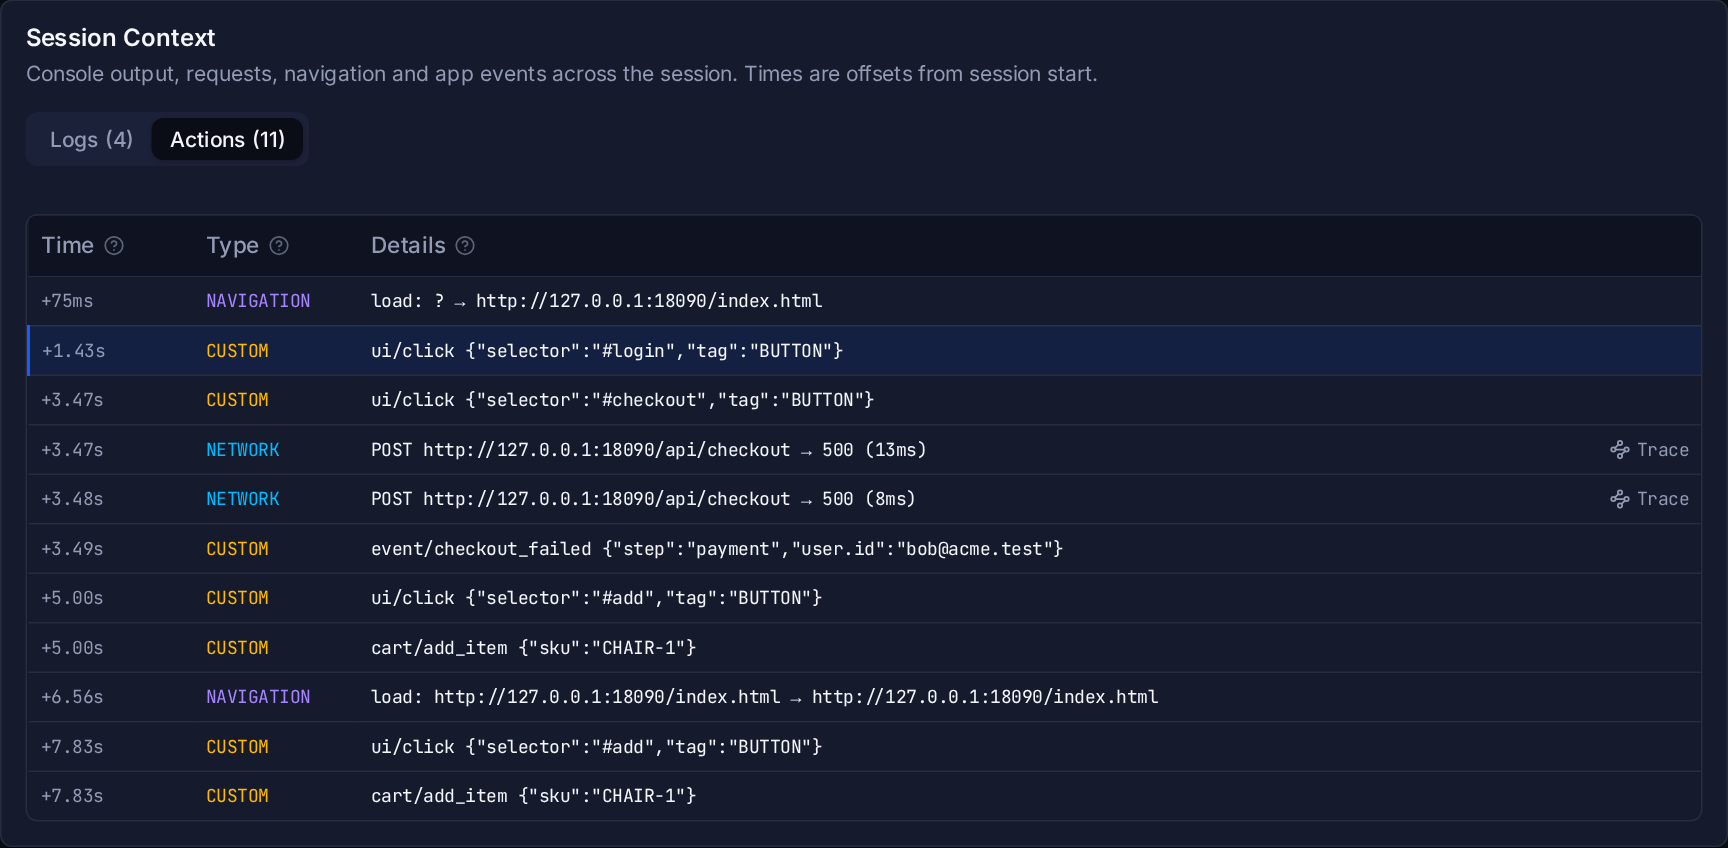
Sessions recorded by older SDKs (1.x browser, mobile) still carry their logs and actions inside the replay, and those pages show them as before.
Safety
- The app sets the outer limits. Nothing remote can turn on what
init()turned off. - The plan narrows them. What the plan does not include is off, and stays off under triggers and captures.
- Replay masks inputs by default.
maskAllInputsis on unless a rule turns it off. - No code runs from the server. The settings document is data: modes, numbers and matchers checked by a fixed set of operators. Each rule’s settings are capped at 16 KiB; the merged response can be larger. Poll request bodies are capped at 64 KiB.
- The server learns what sessions already carry. A poll reports the app's resource attributes, the session id and the global attributes the app set, the same data already attached to sessions and issues.
Next: Set up remote config walks through the SDK and the dashboard, and the settings reference lists every field.