Real User Monitoring (RUM)
Real User Monitoring tells you how your frontend performs for the people using it, and gives you the evidence to explain one bad experience. In Traceway that is Web Vitals and browser metrics, dashboards, release comparisons, SLOs, alerts, errors, sessions and replay in one workflow, built on OpenTelemetry.
A successful API request does not tell you whether a page loaded slowly, a button froze or content shifted under a user's pointer. RUM measures those browser experiences on every visit. Session replay is the investigation layer: use it to understand a recorded journey after metrics show where to look.
Two ideas make it different from a replay tool with charts attached:
- Every visit is measured, almost nothing is uploaded. Performance numbers are aggregated on the device into histograms, so a session costs one small payload whether it had three interactions or three thousand.
- The detail waits on the device. Clicks, requests, console lines and the replay sit in a ring buffer in the browser. They leave only when something goes wrong, or when you ask for them. A healthy session uploads no breadcrumbs and no replay.
Setting up an app? RUM Best Practices explains what metrics, sessions, exceptions and logs each represent, which one to use for what, and how to identify users and find their sessions.
What you get
| Capability | What it covers |
|---|---|
| Web Vitals | LCP, INP, CLS, FCP and TTFB per page load, plus INP and CLS per view so single-page-app route changes are measured too |
| Page and route timing | Page load, DOM ready, transfer size, how long a route change takes to settle, long tasks and total blocking time |
| Requests | Duration and failure rate of fetch and XHR by host, with the W3C traceparent header that joins a browser request to its backend trace |
| Who is affected | Page views, sessions, browser profiles per day, and profiles affected by an error, a poor vital, a rage click or a failed request, counted on the device so no id is sent |
| What is behind a slow value | The element behind a poor LCP, INP or CLS, the script behind main-thread time, and a link to a session that experienced it |
| Segments | Release, environment, route, browser, OS, form factor, device class, network type, country, and two dimensions of your own |
| Web Performance dashboard | Assigned when the project is created: percentiles, rating shares and breakdowns, before you build a chart |
| Release regression alerts | A new release compared with the earlier one, adjusted for device mix and gated on sample size |
| Frontend SLOs | An error budget on a web vital, a route or crash-free sessions, per release or device |
| Errors with context | Source-mapped issues with the 10 minutes of clicks, requests and console lines before them, and a 30 second replay clip |
| Sessions and replay | Every session listed and searchable by attribute; DOM replay with inputs masked by default |
| Recording triggers | Record the journeys you choose: a click sequence, three failed requests in a minute, a log line that repeats |
| Capture on demand | Ask one user's browser, one device or one session for its recent history and a live stream, from the dashboard |
| Remote control | Change what a release, a browser or a share of traffic sends without shipping a build, including a kill switch |
| Your own metrics | metric() and count() for the numbers only your app knows |
How it works
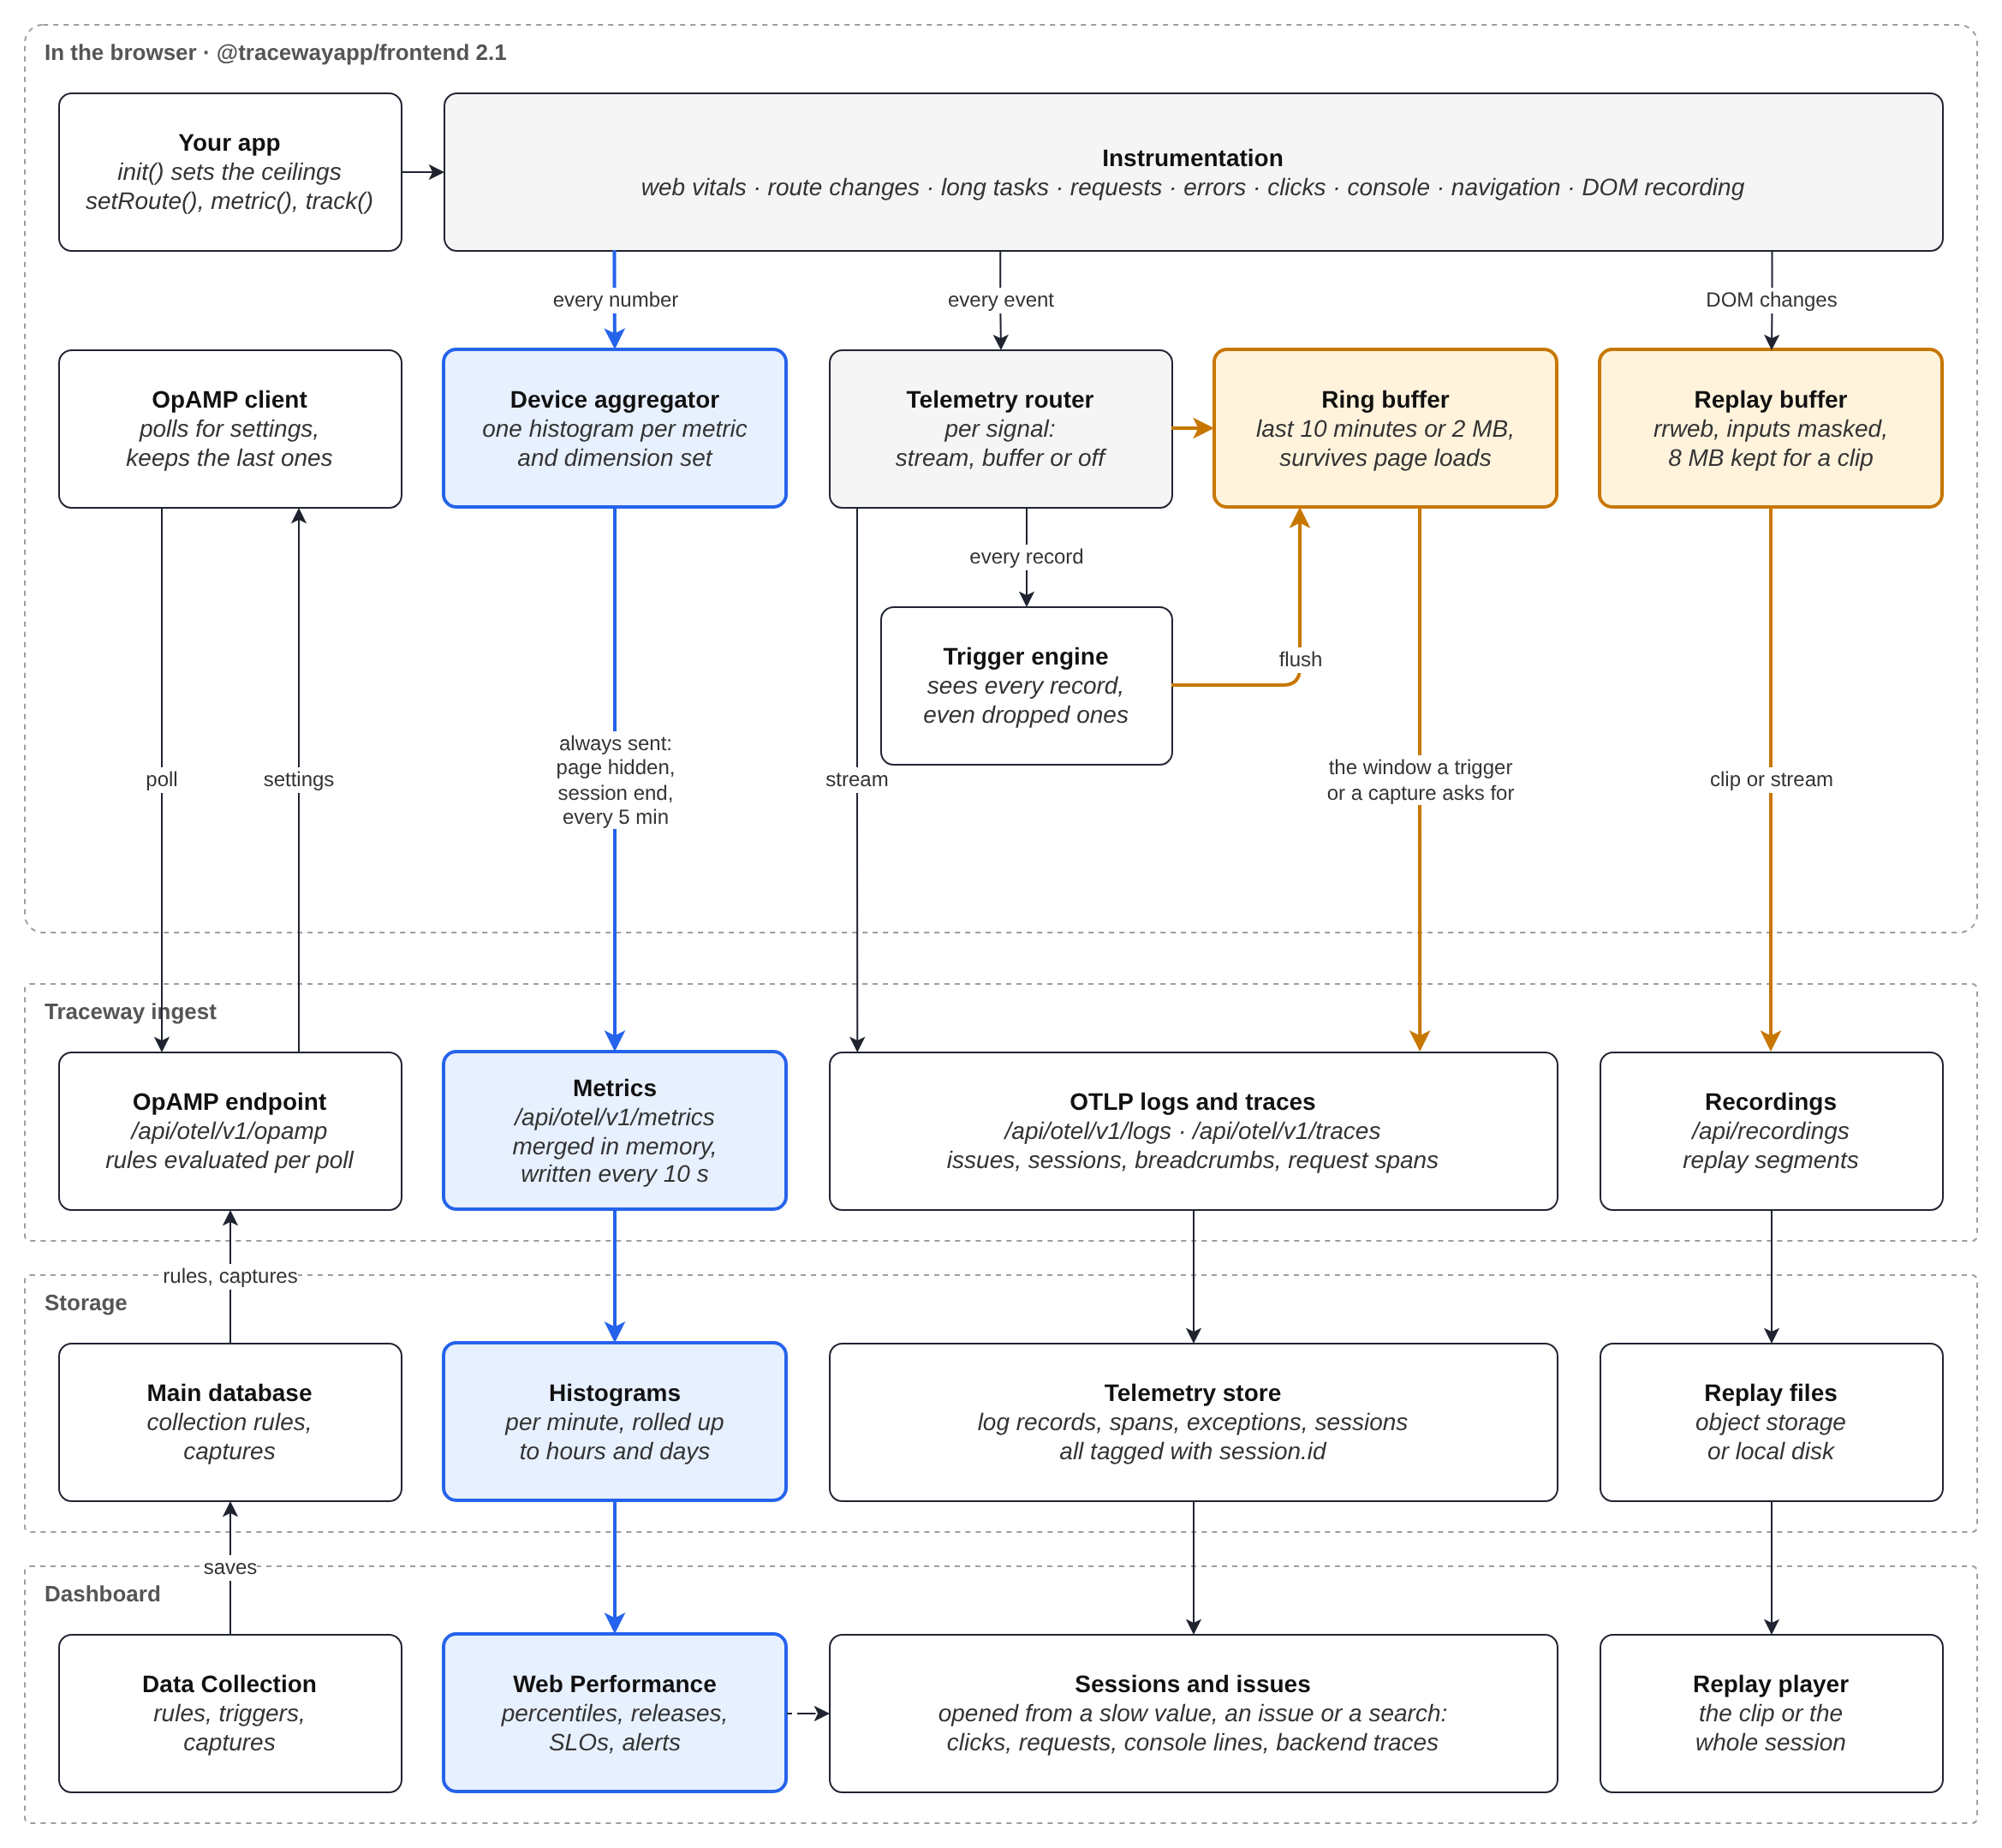
Every measurement in the browser has two outputs:
- The number goes into an aggregate on the device, shown in blue. Aggregates always travel. They are what dashboards, SLOs and alerts read, so those cover every session, not only the ones that had a problem.
- The event goes through the telemetry router, which looks up its signal's mode: stream it now, buffer it on the device, or drop it. Buffered events and the replay, shown in orange, travel only when a trigger or a capture opens the buffer.
A third channel, OpAMP, carries your collection rules from the dashboard to each browser. The SDK is built on the OpenTelemetry Browser SIG instrumentations and speaks standard OTLP/HTTP, so the records are ordinary OpenTelemetry logs, spans and metrics.
Numbers: aggregated on the device
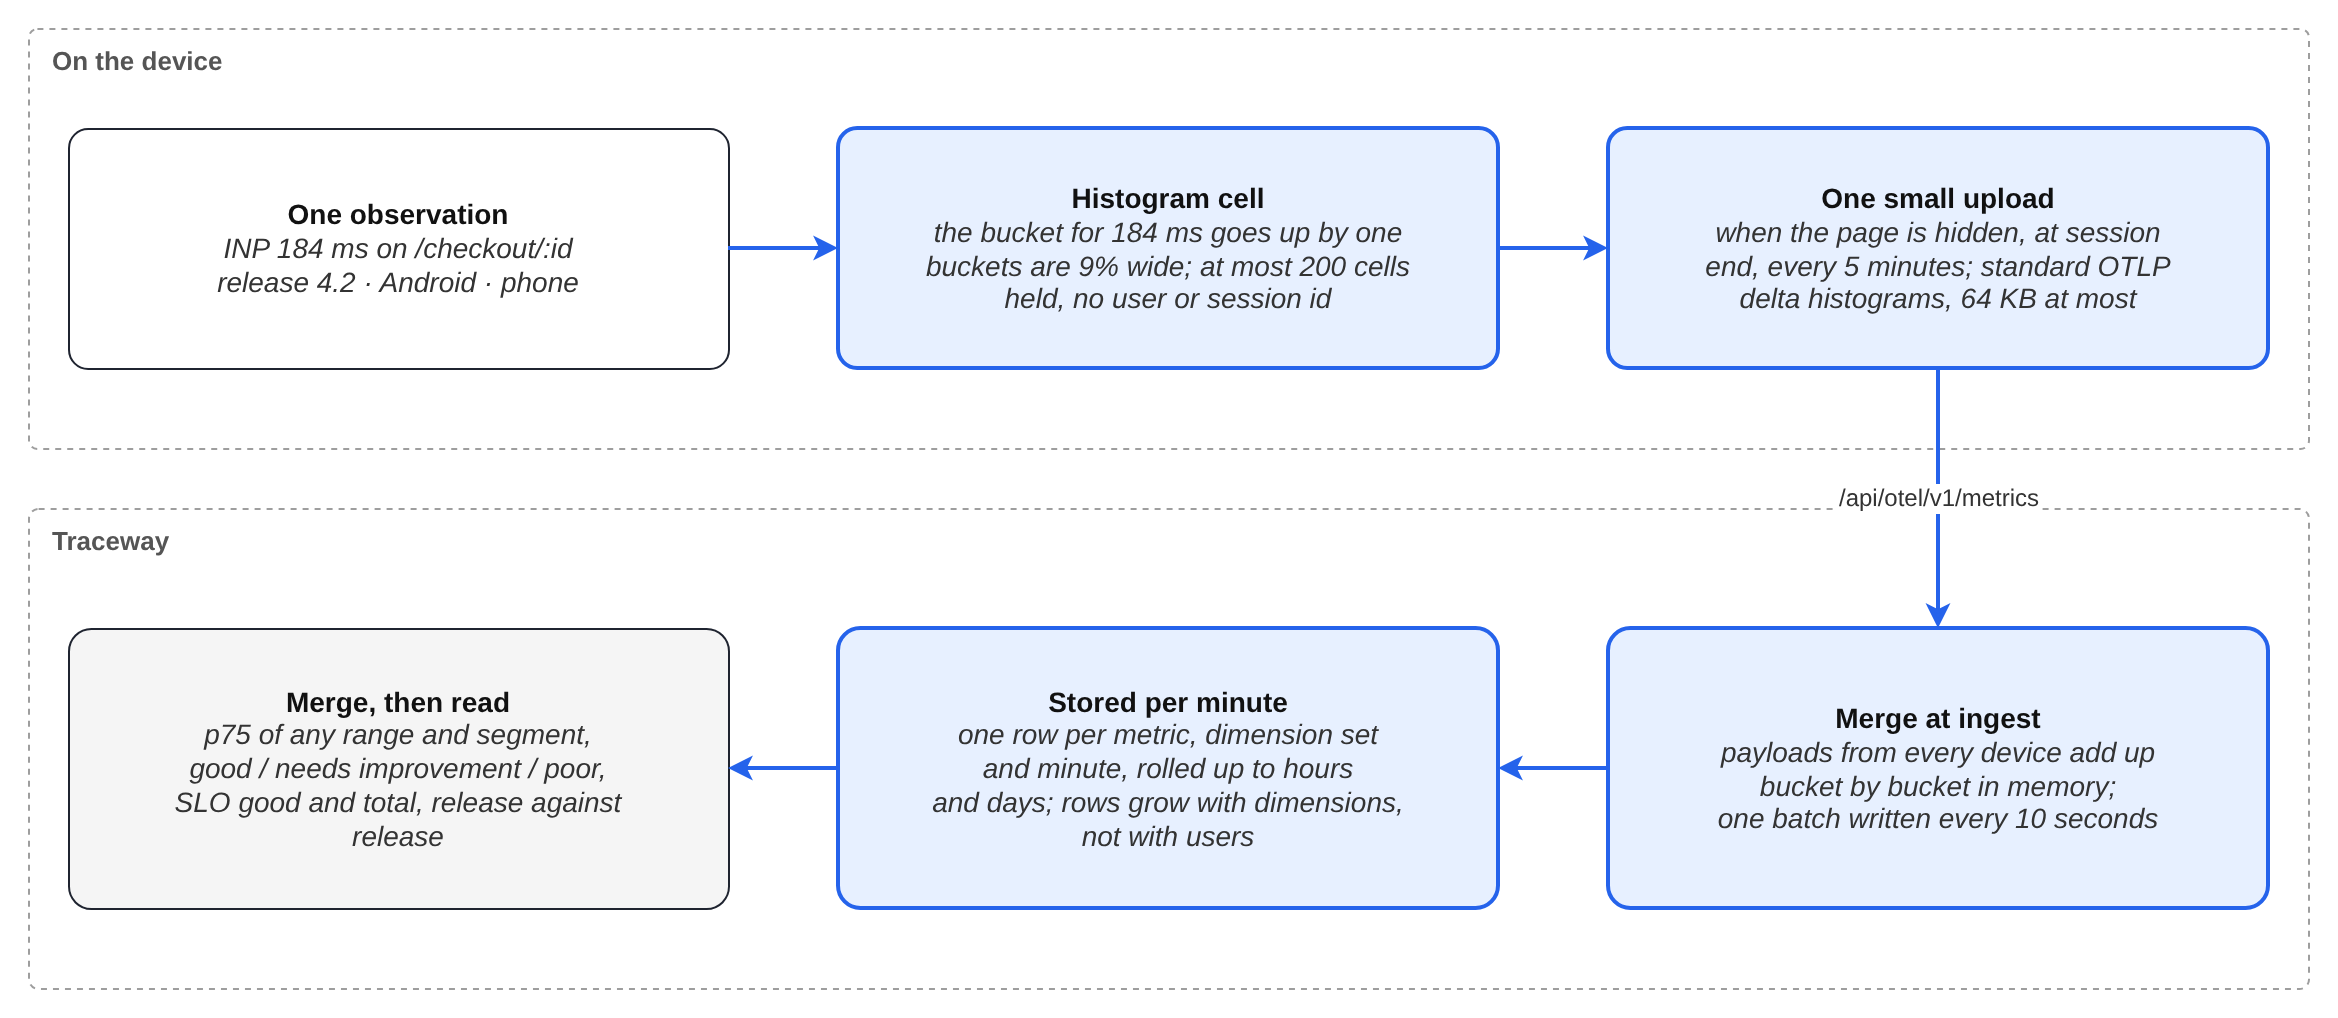
Nobody charts one phone. The question is always about a population: "p75 INP of release 4.2 on Android". So the browser never sends one row per measurement. It keeps a histogram per metric and set of dimensions, and an observation increments a bucket. The page uploads one small payload when it is hidden, at session end, and every five minutes for long sessions.
The consequences are the reason to build it this way:
- Cost follows dimensions, not traffic. A stored row is one metric, one combination of dimensions and one minute. A million users on the same release, route and device class merge into the same rows as a hundred.
- Percentiles stay correct. Buckets from every device add up, and a percentile is read from the merged buckets. Traceway never averages percentiles. Buckets are about 9% wide.
- Metric dimensions group visits. Built-in dimensions use route templates such as
/orders/:idand omit user, session and device IDs. A retained exemplar carries a session ID so you can open the visit behind a poor measurement. "Users affected" is counted by the device itself, once per browser profile per day. - Every session counts. Because metrics do not depend on replay or on an error happening, a fast release and a slow one are compared on all of their traffic.
- A dying page still reports. A payload sent while the page is closing is kept in the browser and sent once more on the next page load; the server recognizes the duplicate.
Names, dimensions, sampling and limits are on Client Metrics.
Detail: the ring buffer
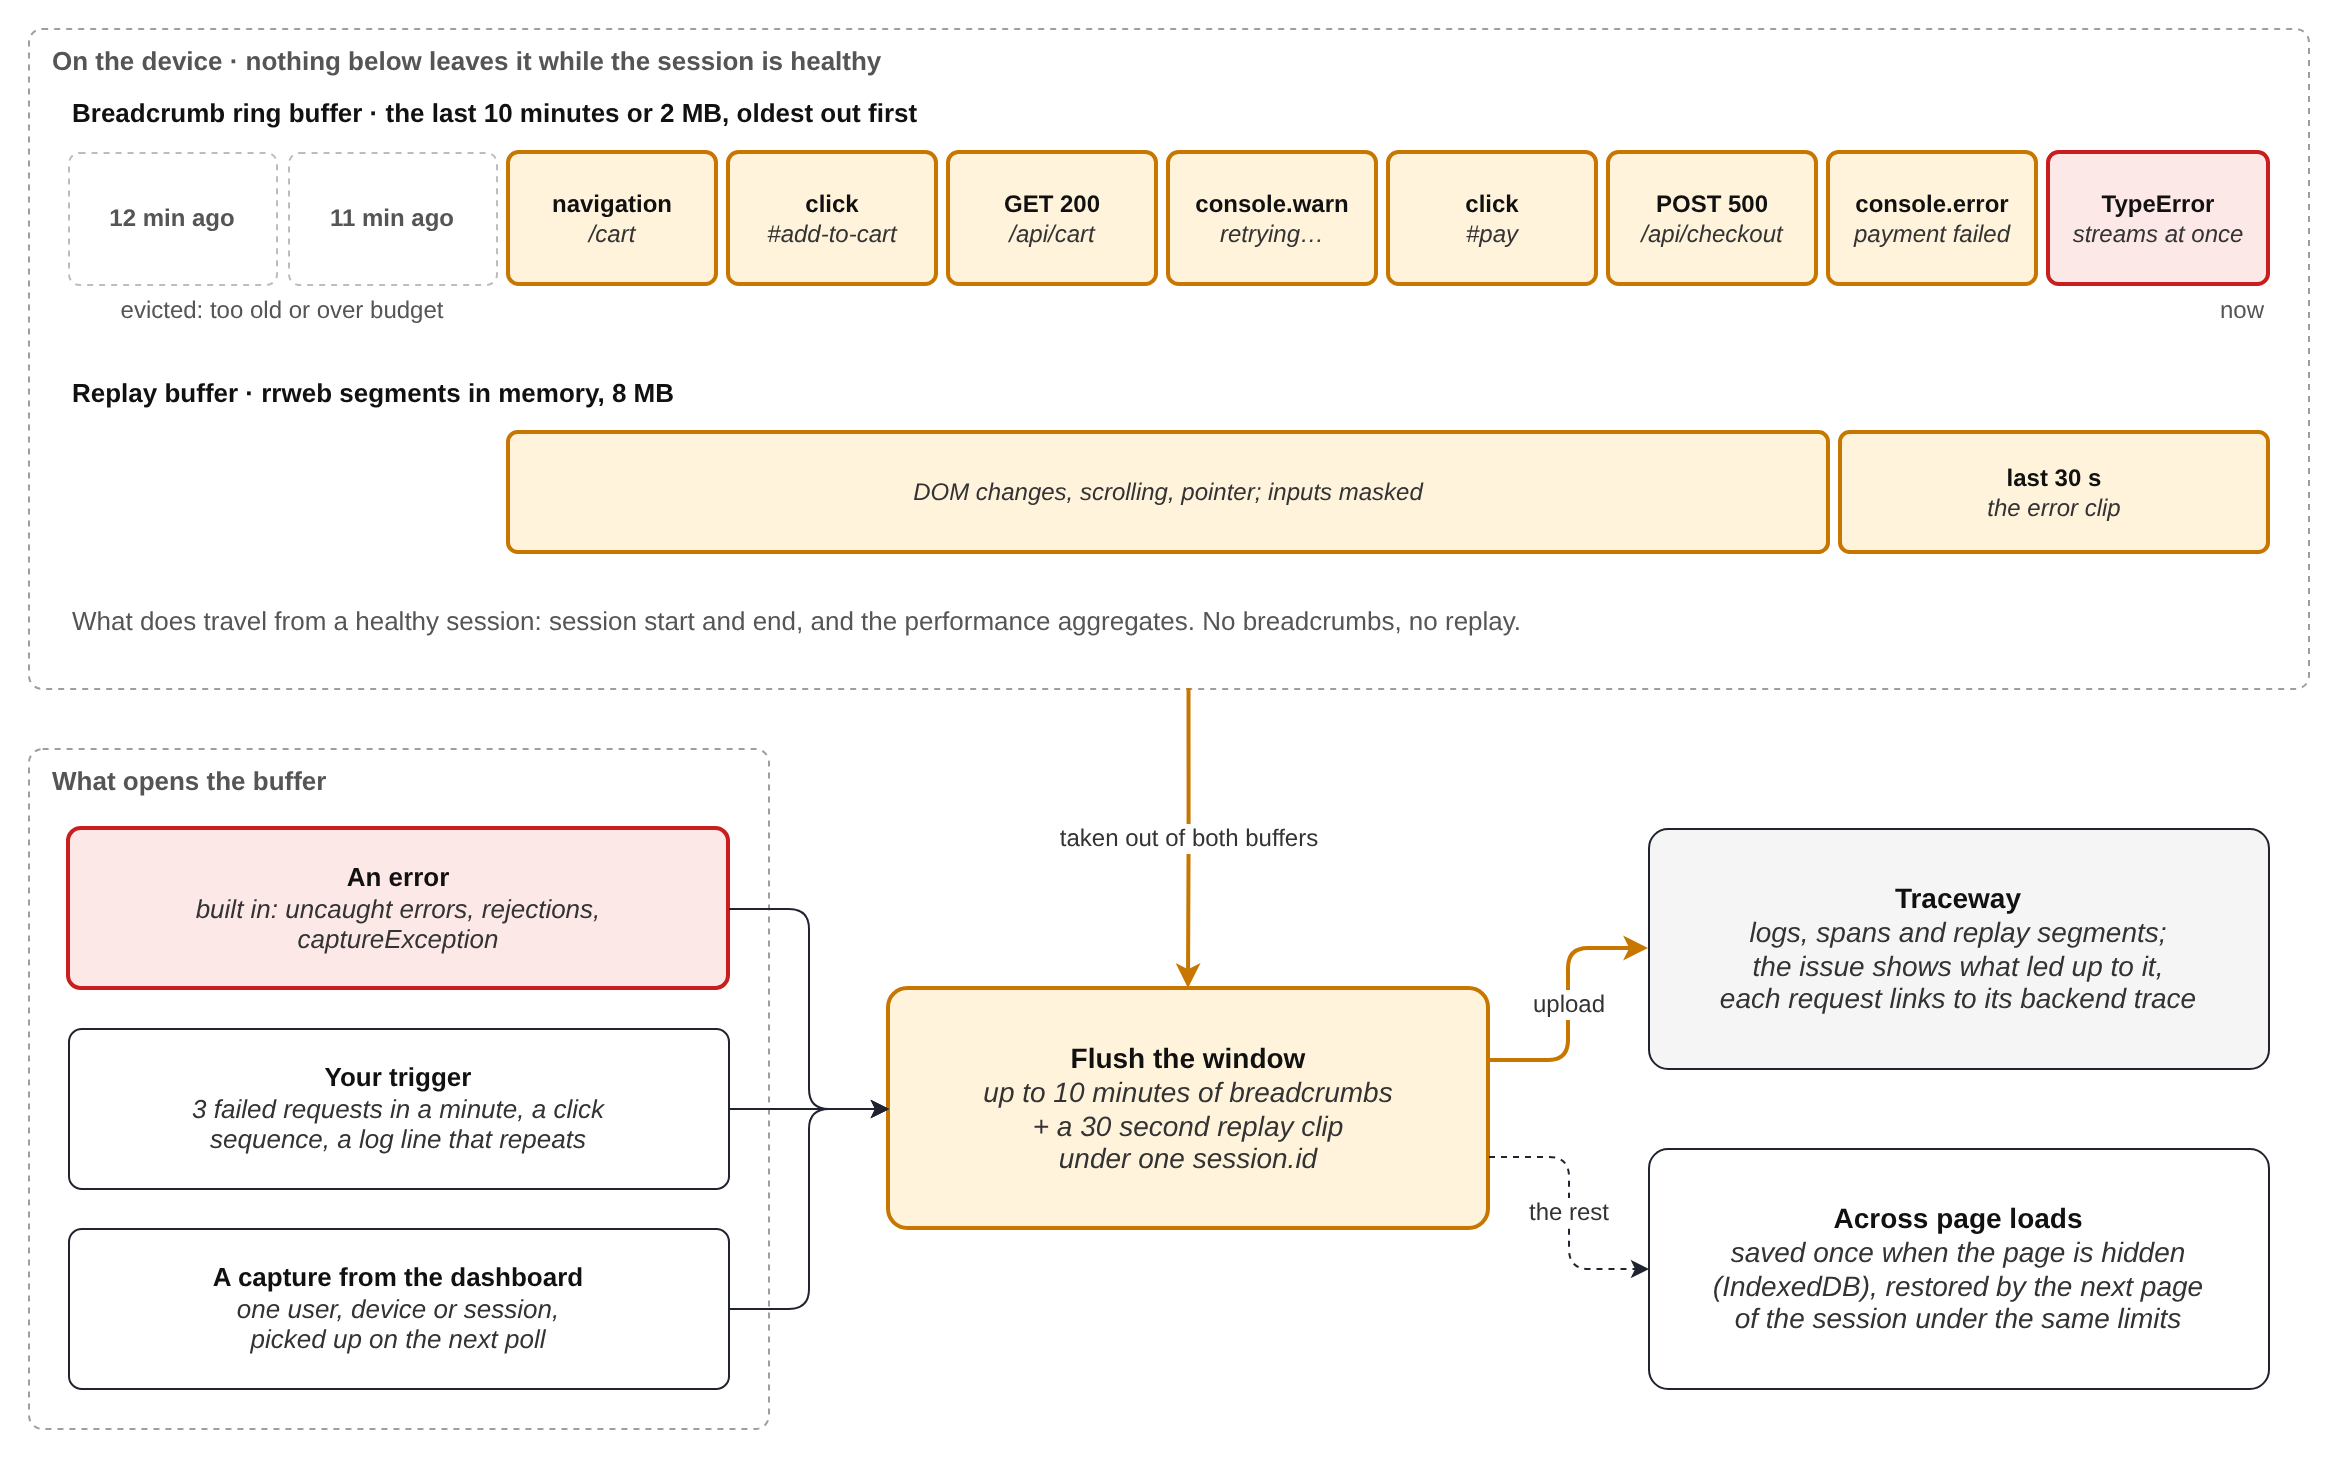
Most sessions are fine, and nobody will ever open their console lines. Uploading them anyway is what makes always-on recording expensive and what puts the most personal data on a server. So the SDK keeps the detail where it was produced:
- A breadcrumb ring buffer holds the newest clicks, navigations, requests, console lines and app events: the last 10 minutes or 2 MB, whichever is reached first. When the budget is exceeded the oldest entries go first.
- A replay buffer holds rrweb segments in memory, up to 8 MB, with inputs masked by default. rrweb is only loaded when replay is not switched off.
- It survives page loads. The buffer is written to IndexedDB once when the page is hidden or unloads (never on a timer, since serializing it would be a long task on a phone), and the next page of the same session restores it under the same limits. A checkout that fails on its third page still has the first two. Replay stays in memory.
Three things open the buffer:
| What | When | What is uploaded |
|---|---|---|
| An error | Built in. An uncaught error, an unhandled rejection or captureException | Up to 10 minutes of breadcrumbs and a 30 second replay clip, attached to the issue |
| Your trigger | A sequence you define in the dashboard: "three failed requests within a minute", "payment failed was logged", "clicked Pay, then left the page" | The window and replay the trigger asks for, tagged with the trigger's name |
| A capture | You click Capture on a session or an issue, or target a user or device | The recent history of that browser, then a live stream for up to 24 hours |
Triggers run in the browser and see every record, including those of a signal that is switched off. You can trigger on a 1 second main-thread freeze on a device that otherwise uploads no long tasks at all.
The buffer is bounded so a page is never harmed by its own monitoring: identical errors within a second are suppressed, a client accepts at most 60 errors a minute, error clips have a 5 second cooldown and a limit of 20 per session, and a session uploads at most 50 MiB or 10,000 diagnostic events. Failed uploads are retried from the browser's storage for up to 24 hours.
The modes, triggers and captures are set from the Data Collection page in the sidebar of a browser project: see Remote SDK Config. The ring buffer, triggers and captures need browser SDK 2.0 or later.
Start with Web Performance
Create a React, Vue, Svelte or jQuery project. Traceway assigns Web Performance immediately, before the first upload. Connect your browser SDK and let it collect traffic; an empty chart on a new project means there is no matching data yet. The aggregated metrics need browser SDK 2.0 or later (@tracewayapp/frontend, or the React, Vue, Svelte or jQuery wrapper of the same version); an app on the legacy 1.x SDK sends none, see the migration guide.
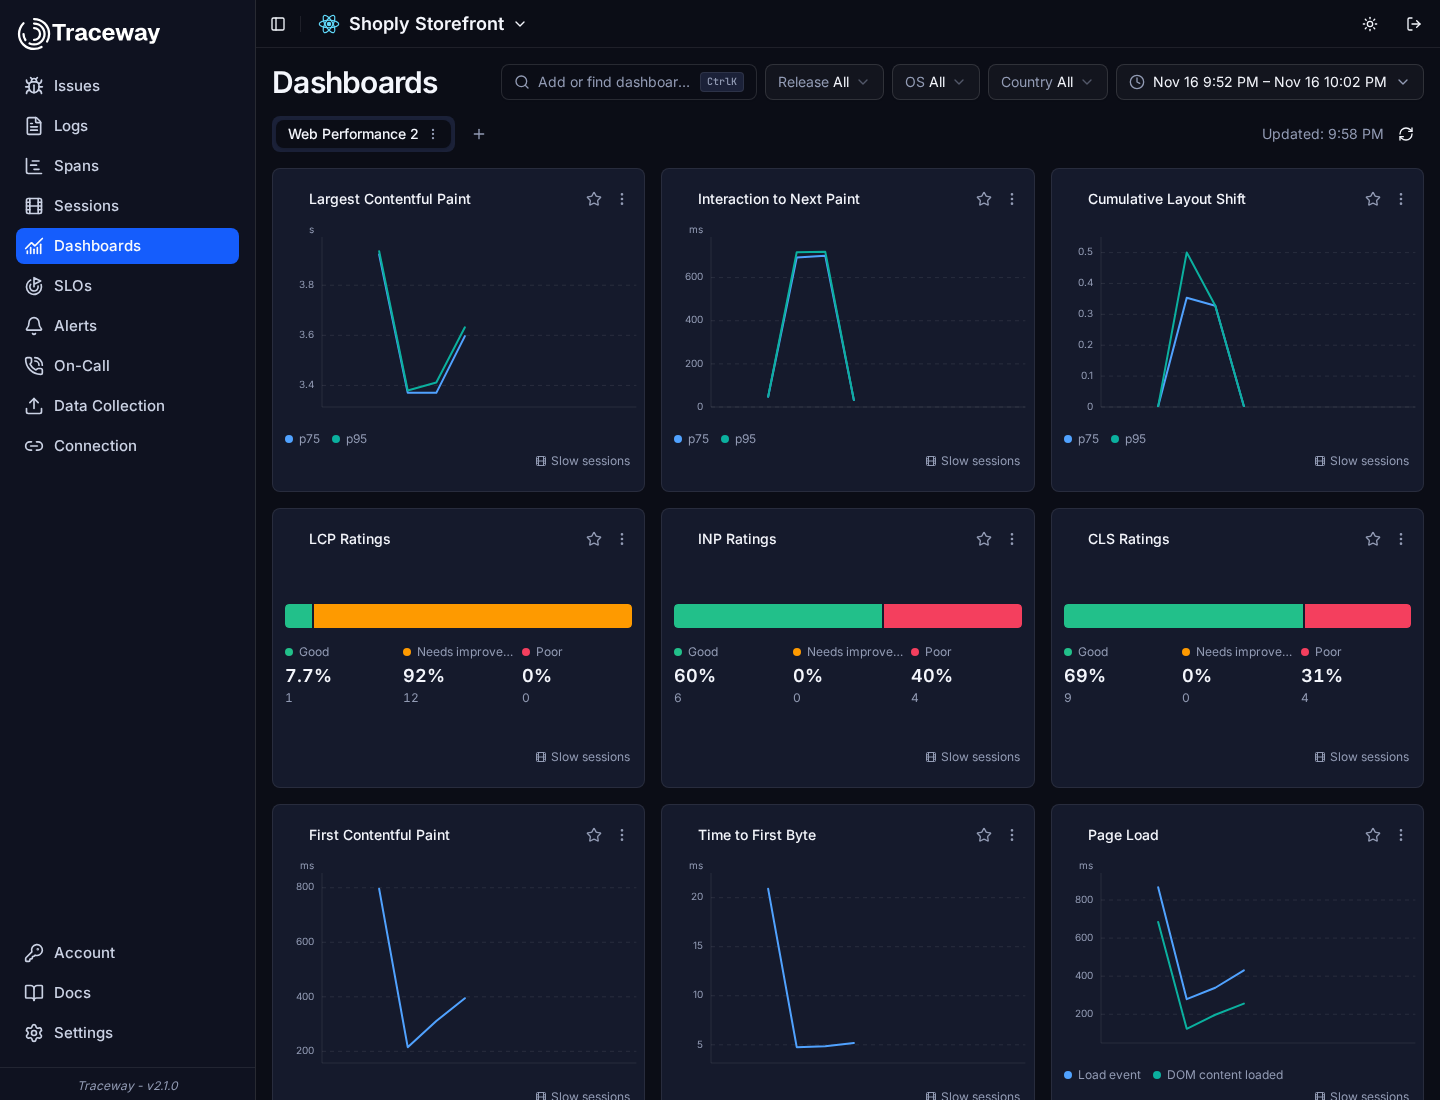
The dashboard brings together:
- Loading: LCP, FCP, TTFB and page-load timing.
- Interaction and stability: INP, CLS, route timings, blocking time and long tasks.
- Impact: requests, page views, sessions and affected browser profiles.
- Context: release, route, device, OS, country, element and script breakdowns where available.
Use p75 to track Web Vitals and p95 to inspect the tail. Read observation volume alongside a percentile. A few slow samples deserve investigation, but are different evidence from a regression across thousands of observed interactions.
Name your routes so the breakdown reads the way your app is built: setRoute("/orders/:id"), or the router helpers of the framework packages (useTracewayRoute in React, trackRouter in Vue, trackRoute in Svelte). Without a name, path segments that look like ids are replaced with :id.
Find the population that changed
Start with a release comparison, then narrow by OS or country. Use a breakdown table for routes, device form factors or other dimensions. A healthy aggregate can conceal a poor phone experience; a changing mix of devices can also move a percentile without a code regression.
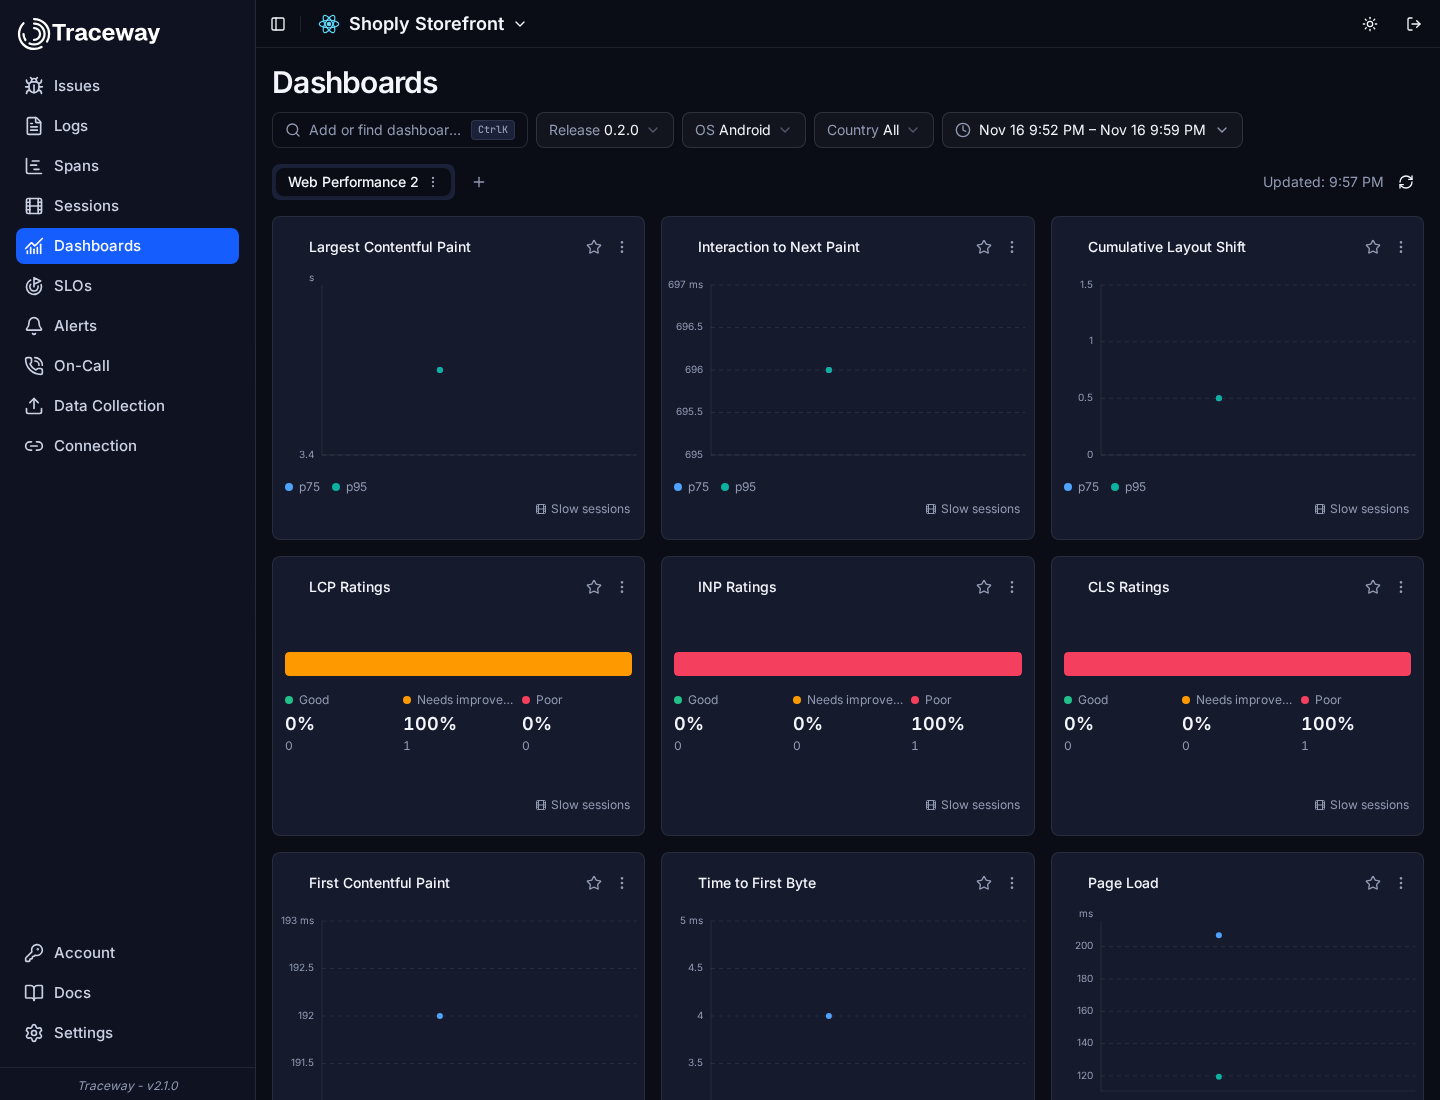
Metric Threshold alerts detect a bad current experience. Release Regression alerts compare a sufficiently observed new release with an earlier one. The default comparison can adjust for device and OS mix; Compare Within compares matching segments. Minimum-count gates and percentile confidence intervals use effective sample size, so one heavily weighted observation cannot pretend to be thousands of independent measurements. See client metrics.
Make performance an objective
An SLO answers a different question from a chart: what share of observed experiences should meet our promise over time?
For example, select browser.web_vital.inp, Every observation, ≤ 200 ms, and choose the target and rolling window for your application. Each estimated good interaction contributes to the numerator; all observed interactions contribute to the denominator. One SLO per release or device gives each population its own budget.
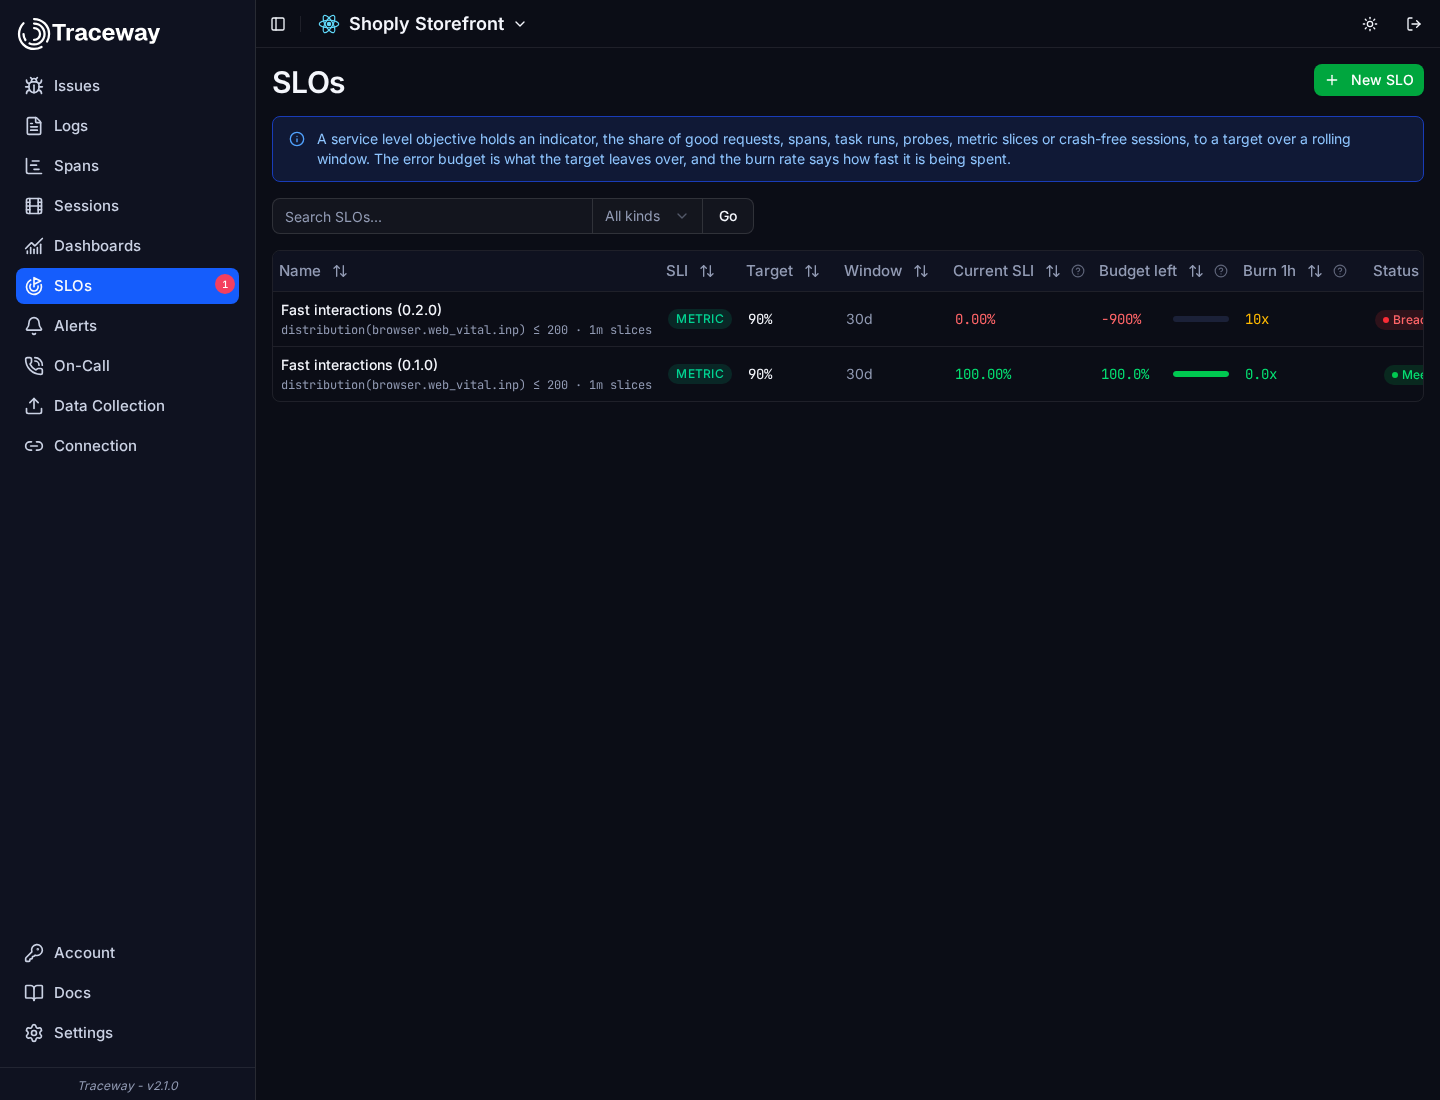
The demo's fast release meets its objective and the intentionally slow release breaches it. This makes the decision concrete: which release changed, which population suffered, and how much budget remains? Use multi-window burn-rate alerts for sustained budget consumption. Keep a separate crash-free-session objective for reliability; a fast interaction does not prove a session was error-free.
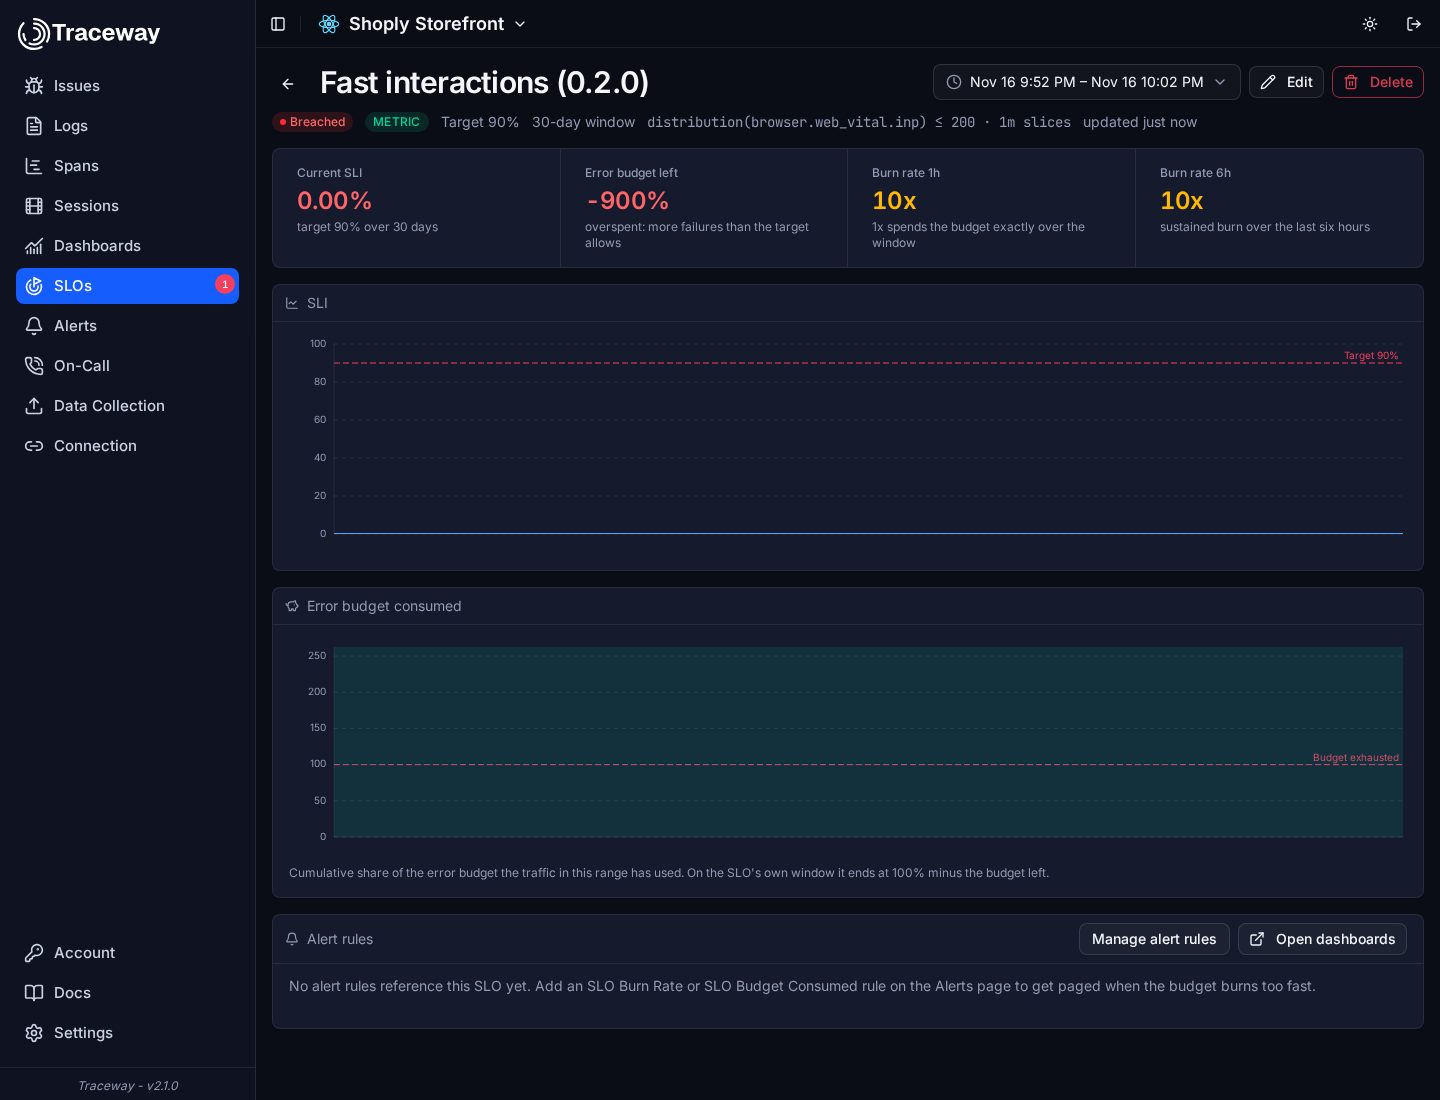
A page with no interaction has no INP sample, not a zero-millisecond interaction. Missing telemetry is not success. Histogram threshold counts and sampled totals are estimates, and a distribution SLO cannot count an unobserved event as a failure. SLO setup and semantics →
Follow the signal into a session
Open Slow sessions on a distribution widget. When an exemplar was retained, it links a poor observation to its session and may name the responsible element. Inspect the session's timeline, errors and network activity, then watch replay if a recording was captured.
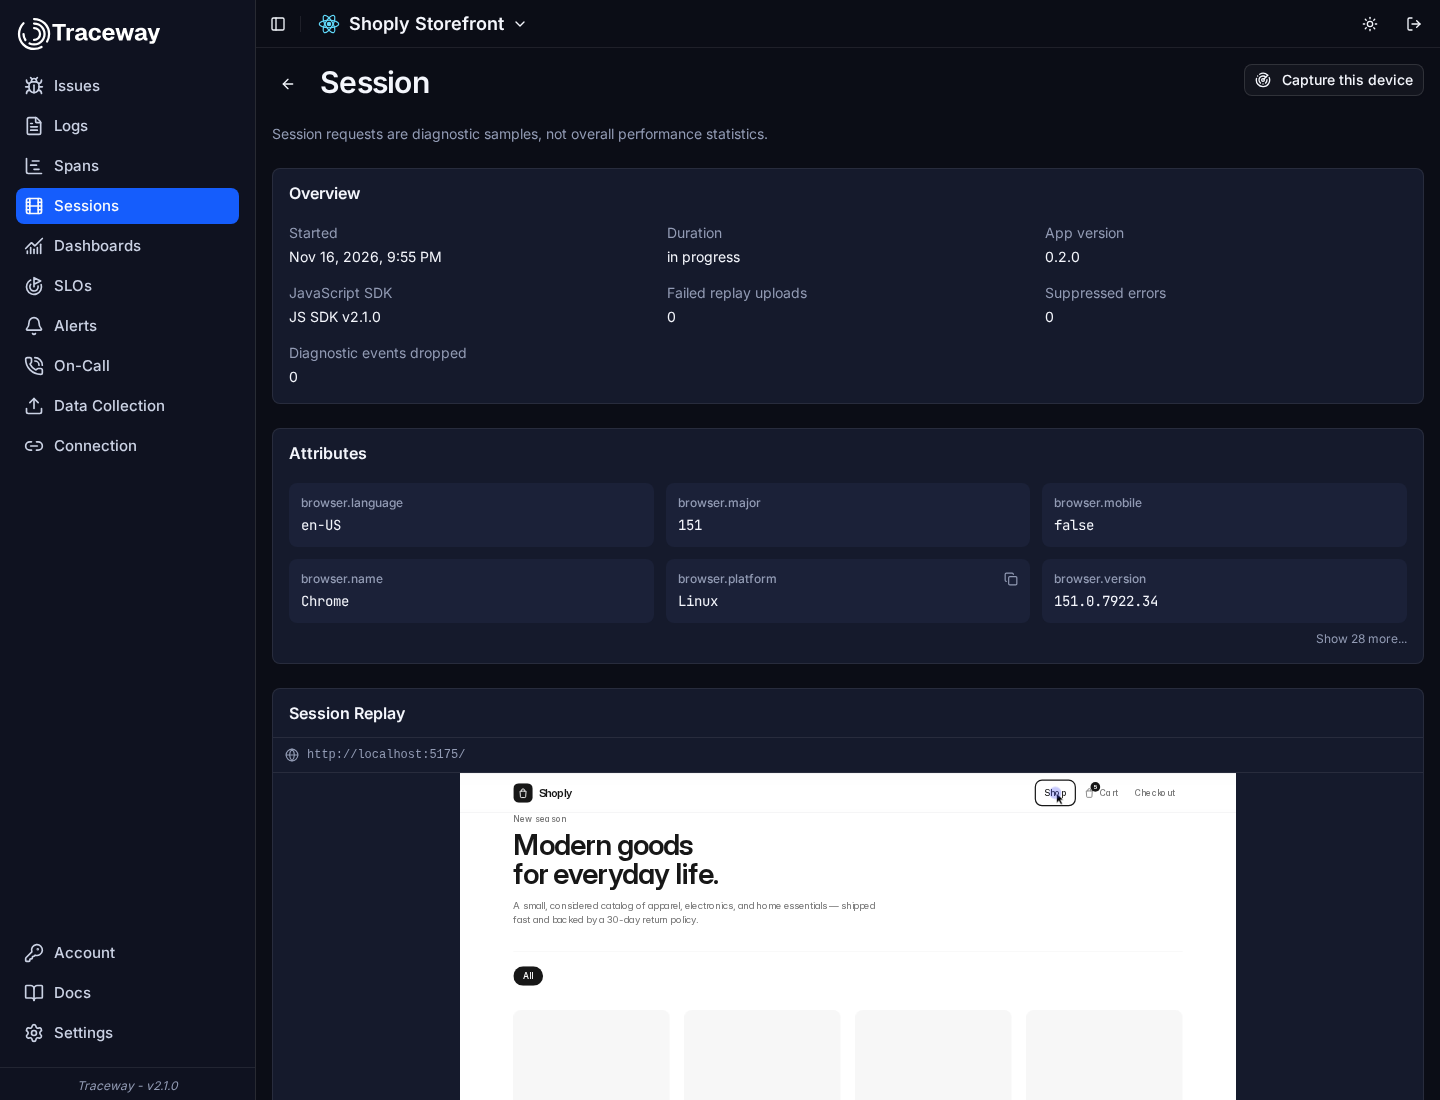
Each request in the timeline links to its trace, where the browser's request sits above the backend work it caused: the browser SDK sends the W3C traceparent header, so both sides share one trace id. See distributed tracing.
Replay does not need to record every session for metrics to work. Its availability depends on your SDK version and Data Collection settings. Review masking and consent before enabling collection. Sessions and replay → · SDK recording controls →
Record specific user journeys
Build click, hover, navigation and log sequences through the recording trigger editor. A completed sequence requests replay and adds a filterable reason to the session. Multiple triggers can explain the same recording, and their historical names and sequences remain available after a rule changes.
When one customer reports a problem you cannot reproduce, start a capture instead: target their user.id, their device or their open session, and the browser uploads what its ring buffer holds on its next check-in, then streams everything until the capture ends. See captures.
Measure what only your app knows
The browser SDK takes your own numbers into the same pipeline, aggregated on the device like the built-in ones:
import { metric, count, setMetricDimension } from "@tracewayapp/frontend";

metric("checkout.render", 412, { step: "payment" }); // a distribution: p75, p95, good ratio
count("search.empty_result");                         // a counter
setMetricDimension("plan", "pro");                    // on every metric this page sends
A project can have 50 custom metric names, each with two dimensions, and two global custom.<key> dimensions on every metric. Use them for a plan, a tenant tier or an experiment arm, never for an id. See client metrics.
Query and build your own charts
Use a line chart for the trend, a Rating Bar for good / needs improvement / poor shares, and a Breakdown Table for a whole-window comparison. Create metric sources with stable tag filters and a group-by dimension. Save reusable definitions through Dashboards as code.
For an API query, use an authenticated account token with access to the project, not its public ingest token. Send POST /api/metrics/query?projectId=PROJECT_UUID with UTC timestamps for your chosen range:
{
  "queries": [
    { "name": "browser.web_vital.inp", "aggregation": "p75", "groupBy": "service.version" },
    { "name": "browser.web_vital.inp", "aggregation": "count", "groupBy": "service.version" },
    { "name": "browser.web_vital.inp", "aggregation": "good_ratio", "threshold": 200, "groupBy": "service.version" }
  ],
  "from": "2026-11-16T00:00:00Z",
  "to": "2026-11-17T00:00:00Z",
  "wholeRange": true
}
wholeRange merges the window before calculating each result. Never average a series of p75 values to get the window's p75. Query good_ratio is a fraction from 0 to 1; notification-rule thresholds use percentages from 0 to 100. Use count for distribution observations and sum for delta counters such as page views. Counter count counts stored points, not events.
Use tagFilters to restrict an environment or population. For a trend, omit wholeRange and choose intervalMinutes, such as 15. Inspect response errors and truncation information before interpreting an empty result as healthy. Metric names, dimensions, sampling and limits →
Privacy and control
- Built-in metric dimensions omit identifiers. Slow-session exemplars can include a session ID and the element associated with the measurement.
- Replay masks inputs by default, and the detail of a healthy session never leaves the device.
- The app sets the outer limits. What
init()switches off (sessionRecording: false,captureLogs: false, ...) cannot be switched on from the server. - No code runs from the server. Collection rules are data: modes, numbers and matchers with a fixed set of operators.
- A kill switch turns a broken release or browser version off without a deploy.
Why this workflow helps
Prioritize with context. Combine experience quality with volume and affected users, rather than treating every slow value as equally urgent. Browser-profile counts are not globally deduplicated people; across days they represent user-days.
Agree on a measurable promise. Product and engineering can discuss a specific population, threshold and budget. Choose objectives from your users' needs and history rather than adopting a universal target.
Keep diagnosis connected. A release comparison narrows the problem, a session provides individual context, and replay and source-mapped errors help explain the failure. Each layer answers the next question.
Screenshots use a controlled storefront demo and real browser visits. Release 0.2.0 was deliberately slowed to demonstrate the workflow; these results are not a customer benchmark or a claim of production-scale validation.